Impacts of an invasive snail (Tarebia granifera) on nutrient cycling in tropical streams: the role of riparian deforestation in Trinidad, West Indies
- PMID: 22761706
- PMCID: PMC3382606
- DOI: 10.1371/journal.pone.0038806
Impacts of an invasive snail (Tarebia granifera) on nutrient cycling in tropical streams: the role of riparian deforestation in Trinidad, West Indies
Abstract
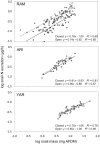
Non-native species and habitat degradation are two major catalysts of environmental change and often occur simultaneously. In freshwater systems, degradation of adjacent terrestrial vegetation may facilitate introduced species by altering resource availability. Here we examine how the presence of intact riparian cover influences the impact of an invasive herbivorous snail, Tarebia granifera, on nitrogen (N) cycling in aquatic systems on the island of Trinidad. We quantified snail biomass, growth, and N excretion in locations where riparian vegetation was present or removed to determine how snail demographics and excretion were related to the condition of the riparian zone. In three Neotropical streams, we measured snail biomass and N excretion in open and closed canopy habitats to generate estimates of mass- and area-specific N excretion rates. Snail biomass was 2 to 8 times greater and areal N excretion rates ranged from 3 to 9 times greater in open canopy habitats. Snails foraging in open canopy habitat also had access to more abundant food resources and exhibited greater growth and mass-specific N excretion rates. Estimates of ecosystem N demand indicated that snail N excretion in fully closed, partially closed, and open canopy habitats supplied 2%, 11%, and 16% of integrated ecosystem N demand, respectively. We conclude that human-mediated riparian canopy loss can generate hotspots of snail biomass, growth, and N excretion along tropical stream networks, altering the impacts of an invasive snail on the biogeochemical cycling of N.
Conflict of interest statement
Figures


References
-
- Vitousek PM, Mooney HA, Lubchenco J, Melillo JM. Human domination of Earth’s ecosystems. Science. 1997;277:494–499.
-
- Moulton LA, Pimm SL. The introduced Hawaiian avifauna: biogeographic evidence for competition. Am Nat. 1983;121:669–690.
-
- Vitousek PM. Biological invasions and ecosystem processes: towards an integration of population biology and ecosystem studies. Oikos. 1990;57:7–13.
-
- Baxter CV, Fausch KD, Murakami M, Chapman PL. Fish invasion restructures stream and forest food webs by interrupting reciprocal prey subsidies. Ecology. 2004;85:2656–2663.
-
- Vanni MJ. Nutrient cycling by animals in freshwater ecosystems. Annu Rev Ecol Syst. 2002;33:341–370.
Publication types
MeSH terms
Substances
LinkOut - more resources
Full Text Sources
Research Materials

