. 2012;7(6):e38950.
doi: 10.1371/journal.pone.0038950. Epub 2012 Jun 27.

Identification of kinases regulating prostate cancer cell growth using an RNAi phenotypic screen

Affiliations

Identification of kinases regulating prostate cancer cell growth using an RNAi phenotypic screen

Hilary Whitworth et al. PLoS One. 2012.

Abstract

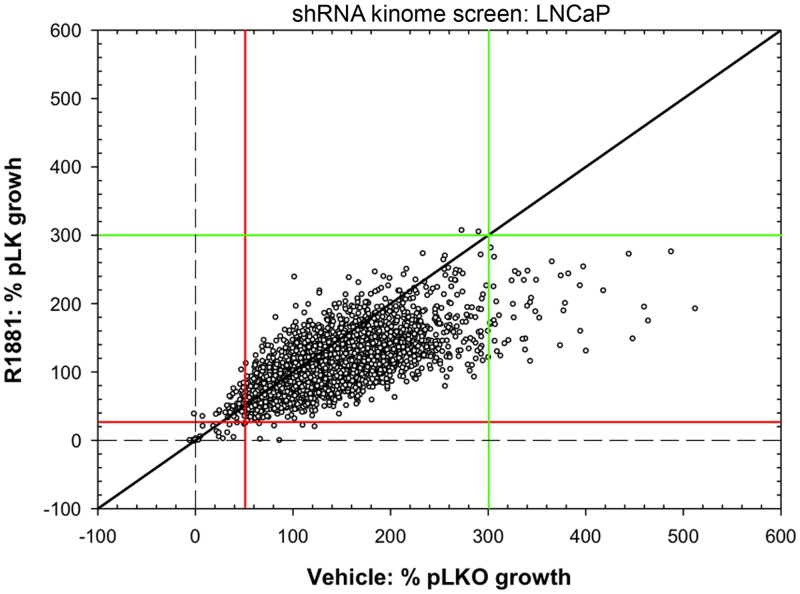
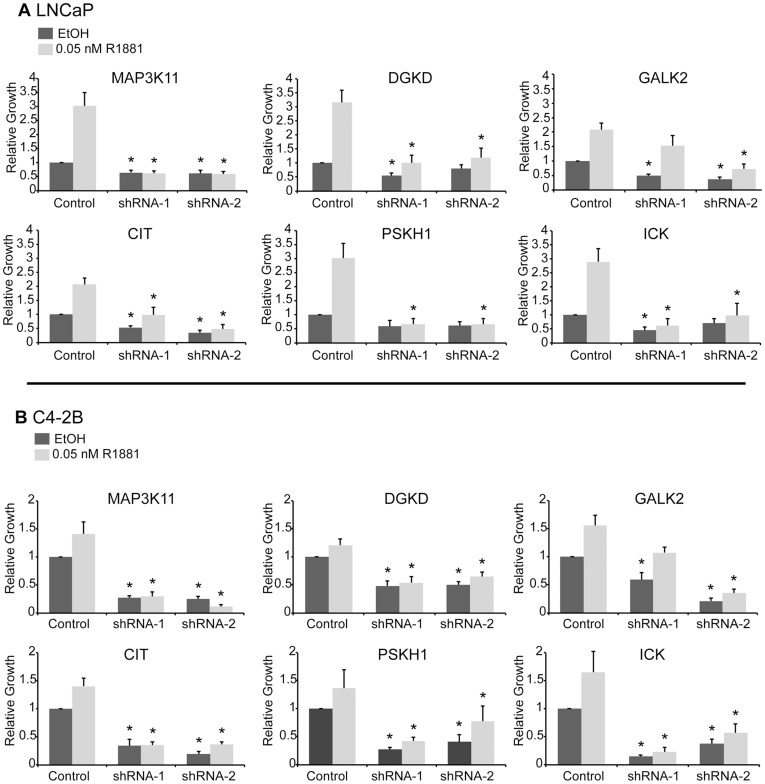
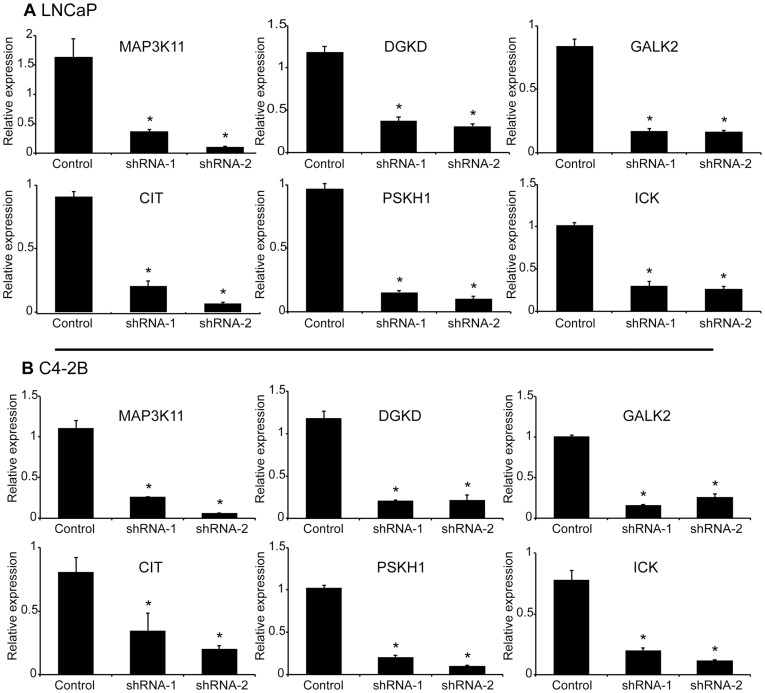
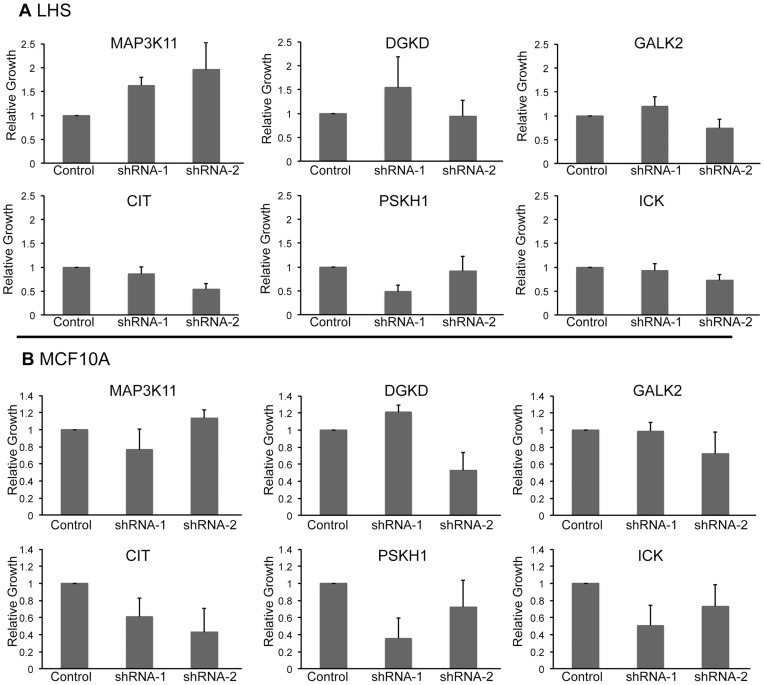
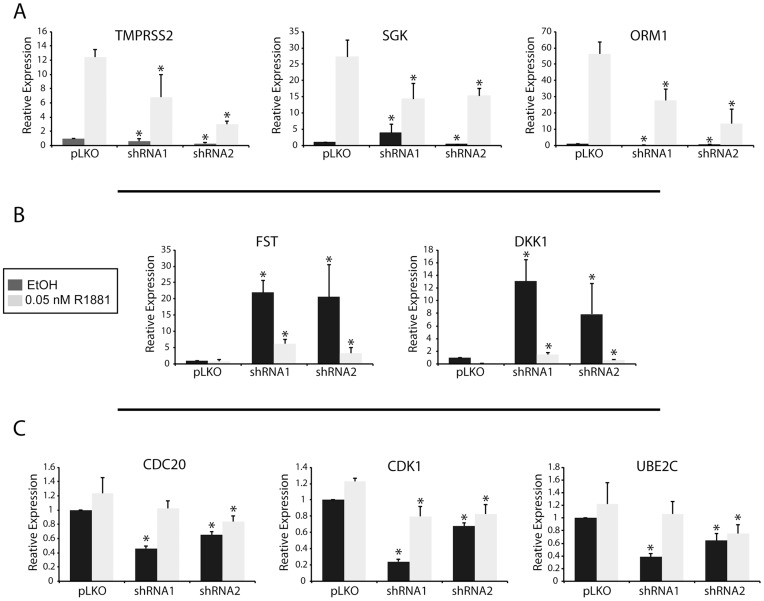
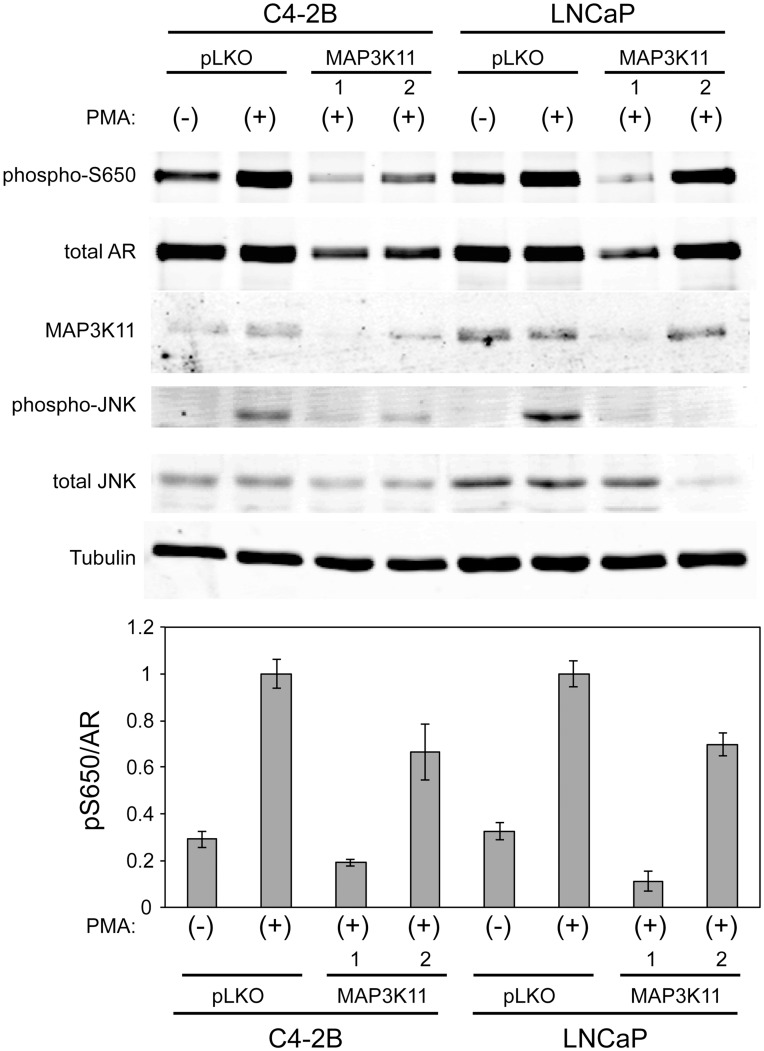
As prostate cancer progresses to castration-resistant disease, there is an increase in signal transduction activity. Most castration-resistant prostate tumors continue to express the androgen receptor (AR) as well as androgen-responsive genes, despite the near absence of circulating androgen in these patients. The AR is regulated not only by its cognate steroid hormone, but also by interactions with a constellation of co-regulatory and signaling molecules. Thus, the elevated signaling activity that occurs during progression to castration resistance can affect prostate cancer cell growth either through the AR or independent of the AR. In order to identify signaling pathways that regulate prostate cancer cell growth, we screened a panel of shRNAs targeting 673 human kinases against LNCaP prostate cancer cells grown in the presence and absence of hormone. The screen identified multiple shRNA clones against known and novel gene targets that regulate prostate cancer cell growth. Based on the magnitude of effect on growth, we selected six kinases for further study: MAP3K11, DGKD, ICK, CIT, GALK2, and PSKH1. Knockdown of these kinases decreased cell growth in both androgen-dependent and castration-resistant prostate cancer cells. However, these kinases had different effects on basal or androgen-induced transcriptional activity of AR target genes. MAP3K11 knockdown most consistently altered transcription of AR target genes, suggesting that MAP3K11 affected its growth inhibitory effect by modulating the AR transcriptional program. Consistent with MAP3K11 acting on the AR, knockdown of MAP3K11 inhibited AR Ser 650 phosphorylation, further supporting stress kinase regulation of AR phosphorylation. This study demonstrates the applicability of lentiviral-based shRNA for conducting phenotypic screens and identifies MAP3K11, DGKD, ICK, CIT, GALK2, and PSKH1 as regulators of prostate cancer cell growth. The thorough evaluation of these kinase targets will pave the way for developing more effective treatments for castration-resistant prostate cancer.


Conflict of interest statement

Competing Interests: The authors have read the journal’s policy and have the following conflicts: Andrea Spencer, Ronald Hernan, and Heather Holemon were employed at Sigma-Aldrich Biotechnology during the RNAi screen. Sigma-Aldrich sells the MISSION library that was used in this study. This does not alter the authors’ adherence to all the PLoS ONE policies on sharing data and materials.

Figures

Figure 1
Figure 1. shRNA kinome-wide screen.
LNCaP cells were transduced in triplicate with three to five shRNAs targeted against 673 human kinases. Cell growth was measured by alamarBlue on day 7. Plotted is the cell growth relative to pLKO empty vector control in response to each shRNA in the presence and absence of hormone (0.05 nM R1881). The red and green lines demarcate cut off points based on controls including pLKO, NTC, media alone, and AR shRNA. The red line indicates growth inhibition and the green line growth.
Figure 2
Figure 2. Kinase knockdown effect on growth.
The relative effect of two independent shRNAs per kinase on cell growth in LNCaP (A) and C4-2B (B) cells. CyQuant Assay measured DNA content as a surrogate for cell number 7 days after shRNA transduction. The experiment was done in the presence and absence of hormone (0.05 nM R1881), n = 3 to 7 depending on the kinase. Cell growth was compared to untreated pLKO control and the values were averaged across biological replicates. Error bars represent standard error of the mean. ∗ denotes statistical significance.
Figure 3
Figure 3. shRNA effect on target expression.
Kinase transcript levels in LNCaP (A) and C4-2B (B) cells following knockdown with two independent shRNAs per kinase. Transcript levels were measured by qPCR on day 4 following transduction and 2 hours after R1881 hormone treatment (vehicle, 0.05, 0.5, and 1 nM). Transcript levels were compared to untreated pLKO control and normalized to the housekeeping gene, PSMB6. Values were averaged across hormone concentrations and biological replicates. Error bars represent standard error of the mean. ∗ denotes statistical significance.
Figure 4
Figure 4. Kinase knockdown has minimal effect on non-cancer cells.
The relative effect of two independent shRNAs per kinase on cell growth in LHS (A) and MCF10A (B) cells. CyQuant Assay measured DNA content as a surrogate for cell number 7 days after shRNA transduction. n = 2 for LHS cells and n = 3 for MCF10A cells. Cell growth was compared to pLKO control and the values were averaged across biological replicates. Error bars represent standard error of the mean.
Figure 5
Figure 5. AR transcriptional activity in response to MAP3K11 knockdown.
(A) Transcript levels of androgen-induced AR target genes that changed in response to MAP3K11 knockdown in LNCaP cells transduced with two independent shRNAs and pLKO control. RNA was isolated 24 hours after addition of R1881 at 1 nM. Transcript levels were measured by qPCR, compared to pLKO and normalized to the housekeeping gene, GUS. (B) Transcript levels of androgen-repressed AR target genes and (C) transcript levels of AR-regulated M-phase genes described in . (B) and (C) were processed as described for (A). Values were averaged across biological replicates, n = 3. Error bars represent standard error of the mean. ∗ denotes statistical significance.
Figure 6
Figure 6. MAP3K11 regulates AR S650 phosphorylation.
LNCaP and C4-2B cells were transduced with two independent shRNAs targeting MAP3K11 or pLKO control. Cells were treated with either vehicle or PMA. Total AR was immunoprecipitated and blotted for phospho-S650 and total AR levels. Cell lysate was blotted for total MAP3K11, total JNK, phospho-JNK, and tubulin. Plotted is the phospho-S650 signal normalized to total AR, n = 3. Quantitation was performed on Odyssey LICOR imaging system. Error bars represent standard error of the mean.

Similar articles

Cited by

References

    1. Gioeli D. Signal transduction in prostate cancer progression. Clin Sci (Lond) 2005;108:293–308. - PubMed
    1. Cunha GR, Ricke W, Thomson A, Marker PC, Risbridger G, et al. Hormonal, cellular, and molecular regulation of normal and neoplastic prostatic development. J Steroid Biochem Mol Biol. 2004;92:221–36. - PubMed
    1. Burnstein KL. Regulation of androgen receptor levels: implications for prostate cancer progression and therapy. J Cell Biochem. 2005;95:657–69. - PubMed
    1. Perez CA. Cancer of the Prostate. In: Cancer. Principles and Practice of Oncology. Philadelphia: J.B. Lippincott Company. 1985. pp. 929–964.
    1. Gioeli DG. The promise of novel androgen receptor antagonists. Cell Cycle. 2010;9:440–1. - PubMed

Publication types

MeSH terms