

Quantifying individual variation in the propensity to attribute incentive salience to reward cues
- PMID: 22761718
- PMCID: PMC3382216
- DOI: 10.1371/journal.pone.0038987
Quantifying individual variation in the propensity to attribute incentive salience to reward cues
Abstract
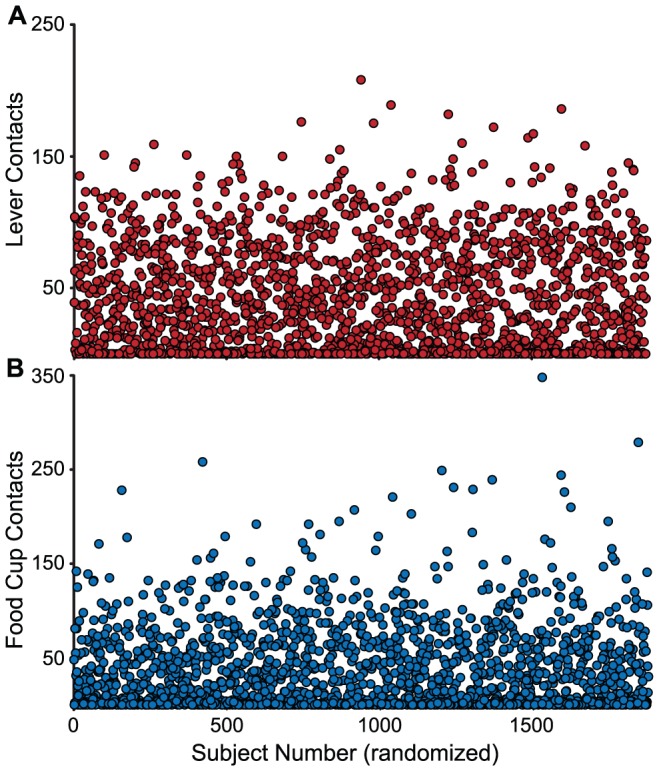
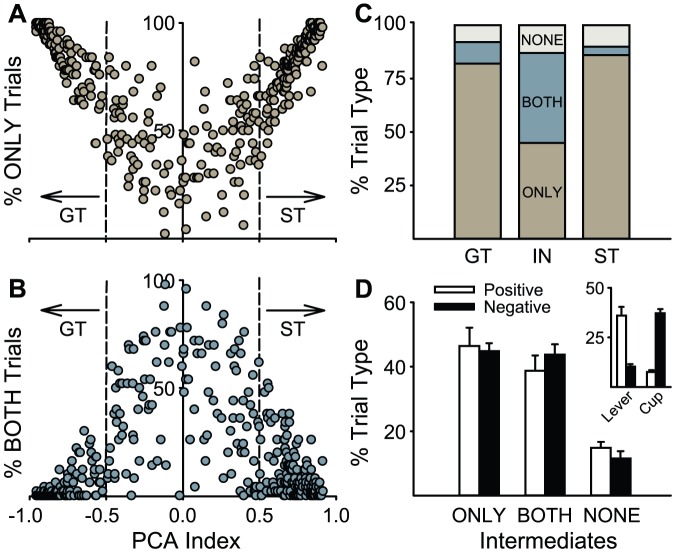
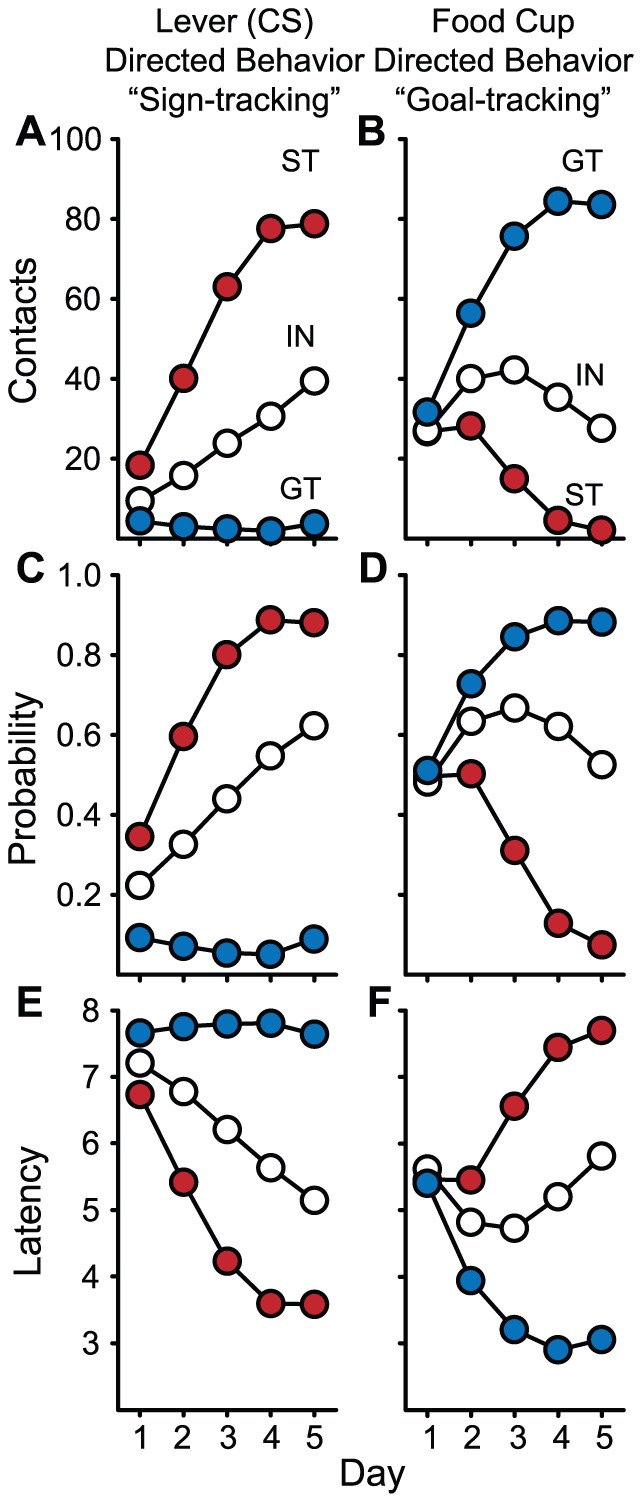
If reward-associated cues acquire the properties of incentive stimuli they can come to powerfully control behavior, and potentially promote maladaptive behavior. Pavlovian incentive stimuli are defined as stimuli that have three fundamental properties: they are attractive, they are themselves desired, and they can spur instrumental actions. We have found, however, that there is considerable individual variation in the extent to which animals attribute Pavlovian incentive motivational properties ("incentive salience") to reward cues. The purpose of this paper was to develop criteria for identifying and classifying individuals based on their propensity to attribute incentive salience to reward cues. To do this, we conducted a meta-analysis of a large sample of rats (N = 1,878) subjected to a classic Pavlovian conditioning procedure. We then used the propensity of animals to approach a cue predictive of reward (one index of the extent to which the cue was attributed with incentive salience), to characterize two behavioral phenotypes in this population: animals that approached the cue ("sign-trackers") vs. others that approached the location of reward delivery ("goal-trackers"). This variation in Pavlovian approach behavior predicted other behavioral indices of the propensity to attribute incentive salience to reward cues. Thus, the procedures reported here should be useful for making comparisons across studies and for assessing individual variation in incentive salience attribution in small samples of the population, or even for classifying single animals.
Conflict of interest statement
Figures


Similar articles
-
Individual differences in the attribution of incentive salience to reward-related cues: Implications for addiction.Neuropharmacology. 2009;56 Suppl 1(Suppl 1):139-48. doi: 10.1016/j.neuropharm.2008.06.027. Epub 2008 Jun 21. Neuropharmacology. 2009. PMID: 18619474 Free PMC article. Review.
-
Individual variation in the propensity to attribute incentive salience to an appetitive cue predicts the propensity to attribute motivational salience to an aversive cue.Behav Brain Res. 2011 Jun 20;220(1):238-43. doi: 10.1016/j.bbr.2011.02.013. Epub 2011 Feb 21. Behav Brain Res. 2011. PMID: 21316397 Free PMC article.
-
Neurons of the Ventral Tegmental Area Encode Individual Differences in Motivational "Wanting" for Reward Cues.J Neurosci. 2020 Nov 11;40(46):8951-8963. doi: 10.1523/JNEUROSCI.2947-19.2020. Epub 2020 Oct 12. J Neurosci. 2020. PMID: 33046552 Free PMC article.
-
Neural Activity in the Ventral Pallidum Encodes Variation in the Incentive Value of a Reward Cue.J Neurosci. 2016 Jul 27;36(30):7957-70. doi: 10.1523/JNEUROSCI.0736-16.2016. J Neurosci. 2016. PMID: 27466340 Free PMC article.
-
On the motivational properties of reward cues: Individual differences.Neuropharmacology. 2014 Jan;76 Pt B(0 0):450-9. doi: 10.1016/j.neuropharm.2013.05.040. Epub 2013 Jun 7. Neuropharmacology. 2014. PMID: 23748094 Free PMC article. Review.
Cited by
-
Distinct effects of ventral tegmental area NMDA and acetylcholine receptor blockade on conditioned reinforcement produced by food-associated cues.Neuroscience. 2015 Aug 20;301:384-94. doi: 10.1016/j.neuroscience.2015.06.021. Epub 2015 Jun 17. Neuroscience. 2015. PMID: 26093048 Free PMC article.
-
A classically conditioned cocaine cue acquires greater control over motivated behavior in rats prone to attribute incentive salience to a food cue.Psychopharmacology (Berl). 2013 Mar;226(2):217-28. doi: 10.1007/s00213-012-2890-y. Epub 2012 Oct 24. Psychopharmacology (Berl). 2013. PMID: 23093382 Free PMC article.
-
Premature responding is associated with approach to a food cue in male and female heterogeneous stock rats.Psychopharmacology (Berl). 2016 Jul;233(13):2593-605. doi: 10.1007/s00213-016-4306-x. Epub 2016 May 5. Psychopharmacology (Berl). 2016. PMID: 27146401 Free PMC article.
-
A Videogame as a Tool for Clinical Screening of Possible Vulnerability to Impulsivity and Attention Disturbances in Children.Children (Basel). 2022 Oct 29;9(11):1652. doi: 10.3390/children9111652. Children (Basel). 2022. PMID: 36360380 Free PMC article.
-
Sign and goal tracker rats process differently the incentive salience of a conditioned stimulus.PLoS One. 2019 Sep 30;14(9):e0223109. doi: 10.1371/journal.pone.0223109. eCollection 2019. PLoS One. 2019. PMID: 31568533 Free PMC article.
References
-
- Robinson TE, Berridge KC. The neural basis of drug craving: an incentive-sensitization theory of addiction. Brain Res Rev. 1993;18:247–291. - PubMed
-
- Rescorla RA. Pavlovian conditioning - its not what you think it is. American Psychologist. 1988;43:151–160. - PubMed
-
- Milton AL, Everitt BJ. The psychological and neurochemical mechanisms of drug memory reconsolidation: implications for the treatment of addiction. Eur J Neurosci. 2010;31:2308–2319. - PubMed
-
- Bindra D. A motivational view of learning, performance, and behavior modification. Psychol Rev. 1974;81:199–213. - PubMed
Publication types
MeSH terms
Grants and funding
LinkOut - more resources
Full Text Sources
