Heterotic trait locus (HTL) mapping identifies intra-locus interactions that underlie reproductive hybrid vigor in Sorghum bicolor
- PMID: 22761720
- PMCID: PMC3382592
- DOI: 10.1371/journal.pone.0038993
Heterotic trait locus (HTL) mapping identifies intra-locus interactions that underlie reproductive hybrid vigor in Sorghum bicolor
Abstract
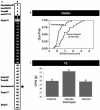
Identifying intra-locus interactions underlying heterotic variation among whole-genome hybrids is a key to understanding mechanisms of heterosis and exploiting it for crop and livestock improvement. In this study, we present the development and first use of the heterotic trait locus (HTL) mapping approach to associate specific intra-locus interactions with an overdominant heterotic mode of inheritance in a diallel population using Sorghum bicolor as the model. This method combines the advantages of ample genetic diversity and the possibility of studying non-additive inheritance. Furthermore, this design enables dissecting the latter to identify specific intra-locus interactions. We identified three HTLs (3.5% of loci tested) with synergistic intra-locus effects on overdominant grain yield heterosis in 2 years of field trials. These loci account for 19.0% of the heterotic variation, including a significant interaction found between two of them. Moreover, analysis of one of these loci (hDPW4.1) in a consecutive F2 population confirmed a significant 21% increase in grain yield of heterozygous vs. homozygous plants in this locus. Notably, two of the three HTLs for grain yield are in synteny with previously reported overdominant quantitative trait loci for grain yield in maize. A mechanism for the reproductive heterosis found in this study is suggested, in which grain yield increase is achieved by releasing the compensatory tradeoffs between biomass and reproductive output, and between seed number and weight. These results highlight the power of analyzing a diverse set of inbreds and their hybrids for unraveling hitherto unknown allelic interactions mediating heterosis.
Conflict of interest statement
Figures


Similar articles
-
Dissecting repulsion linkage in the dwarfing gene Dw3 region for sorghum plant height provides insights into heterosis.Proc Natl Acad Sci U S A. 2015 Sep 22;112(38):11823-8. doi: 10.1073/pnas.1509229112. Epub 2015 Sep 8. Proc Natl Acad Sci U S A. 2015. PMID: 26351684 Free PMC article.
-
Genetic dissection of yield-related traits and mid-parent heterosis for those traits in maize (Zea mays L.).BMC Plant Biol. 2019 Sep 9;19(1):392. doi: 10.1186/s12870-019-2009-2. BMC Plant Biol. 2019. PMID: 31500559 Free PMC article.
-
The genetic basis of heterosis: multiparental quantitative trait loci mapping reveals contrasted levels of apparent overdominance among traits of agronomical interest in maize (Zea mays L.).Genetics. 2012 Feb;190(2):795-811. doi: 10.1534/genetics.111.133447. Epub 2011 Nov 30. Genetics. 2012. PMID: 22135356 Free PMC article.
-
Heterosis: revisiting the magic.Trends Genet. 2007 Feb;23(2):60-6. doi: 10.1016/j.tig.2006.12.006. Epub 2006 Dec 22. Trends Genet. 2007. PMID: 17188398 Review.
-
Allelic variation and heterosis in maize: how do two halves make more than a whole?Genome Res. 2007 Mar;17(3):264-75. doi: 10.1101/gr.5347007. Epub 2007 Jan 25. Genome Res. 2007. PMID: 17255553 Review.
Cited by
-
Dissecting Adaptive Traits with Nested Association Mapping: Genetic Architecture of Inflorescence Morphology in Sorghum.G3 (Bethesda). 2020 May 4;10(5):1785-1796. doi: 10.1534/g3.119.400658. G3 (Bethesda). 2020. PMID: 32217633 Free PMC article.
-
A Boolean gene regulatory model of heterosis and speciation.BMC Evol Biol. 2015 Feb 24;15:24. doi: 10.1186/s12862-015-0298-0. BMC Evol Biol. 2015. PMID: 25888139 Free PMC article.
-
Genetic differentiation analysis for the identification of complementary parental pools for sorghum hybrid breeding in Ethiopia.Theor Appl Genet. 2015 Sep;128(9):1765-75. doi: 10.1007/s00122-015-2545-6. Epub 2015 May 30. Theor Appl Genet. 2015. PMID: 26024715
-
Genes with a Combination of Over-Dominant and Epistatic Effects Underlie Heterosis in Growth of Saccharomyces cerevisiae at High Temperature.Front Genet. 2016 May 4;7:72. doi: 10.3389/fgene.2016.00072. eCollection 2016. Front Genet. 2016. PMID: 27200081 Free PMC article.
-
Dissecting repulsion linkage in the dwarfing gene Dw3 region for sorghum plant height provides insights into heterosis.Proc Natl Acad Sci U S A. 2015 Sep 22;112(38):11823-8. doi: 10.1073/pnas.1509229112. Epub 2015 Sep 8. Proc Natl Acad Sci U S A. 2015. PMID: 26351684 Free PMC article.
References
-
- Morrell PL, Buckler ES, Ross-Ibarra J. Crop genomics: advances and applications. Nature Reviews Genetics. 2011;13:85–96. - PubMed
-
- Darwin CR. The effects of cross- and self-fertilization in the vegetable kingdom. London: John Murray. 1876.
-
- Charlesworth D, Willis JH. Fundamental concepts in genetics The genetics of inbreeding depression. Nature Reviews Genetics. 2009;10:783–796. - PubMed
-
- Riedelsheimer C, Czedik-Eysenberg A, Grieder C, Lisec J, Technow F, et al. Genomic and metabolic prediction of complex heterotic traits in hybrid maize. Nat Genet. 2012;44:217–220. - PubMed
-
- Yu J, Pressoir G, Briggs WH, Vroh Bi I, Yamasaki M, et al. A unified mixed-model method for association mapping that accounts for multiple levels of relatedness. Nat Genet. 2006;38:203–208. - PubMed
Publication types
MeSH terms
LinkOut - more resources
Full Text Sources
Miscellaneous

