

The completeness of the fossil record of mesozoic birds: implications for early avian evolution
- PMID: 22761723
- PMCID: PMC3382576
- DOI: 10.1371/journal.pone.0039056
The completeness of the fossil record of mesozoic birds: implications for early avian evolution
Abstract
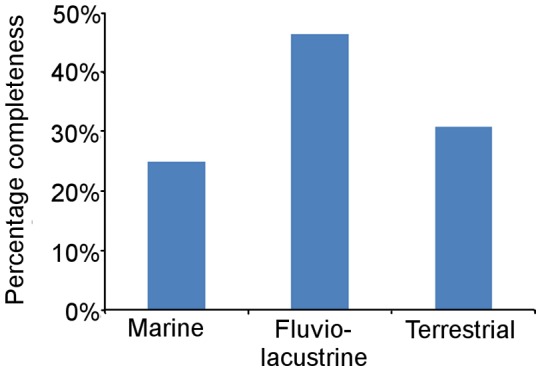
Many palaeobiological analyses have concluded that modern birds (Neornithes) radiated no earlier than the Maastrichtian, whereas molecular clock studies have argued for a much earlier origination. Here, we assess the quality of the fossil record of Mesozoic avian species, using a recently proposed character completeness metric which calculates the percentage of phylogenetic characters that can be scored for each taxon. Estimates of fossil record quality are plotted against geological time and compared to estimates of species level diversity, sea level, and depositional environment. Geographical controls on the avian fossil record are investigated by comparing the completeness scores of species in different continental regions and latitudinal bins. Avian fossil record quality varies greatly with peaks during the Tithonian-early Berriasian, Aptian, and Coniacian-Santonian, and troughs during the Albian-Turonian and the Maastrichtian. The completeness metric correlates more strongly with a 'sampling corrected' residual diversity curve of avian species than with the raw taxic diversity curve, suggesting that the abundance and diversity of birds might influence the probability of high quality specimens being preserved. There is no correlation between avian completeness and sea level, the number of fluviolacustrine localities or a recently constructed character completeness metric of sauropodomorph dinosaurs. Comparisons between the completeness of Mesozoic birds and sauropodomorphs suggest that small delicate vertebrate skeletons are more easily destroyed by taphonomic processes, but more easily preserved whole. Lagerstätten deposits might therefore have a stronger impact on reconstructions of diversity of smaller organisms relative to more robust forms. The relatively poor quality of the avian fossil record in the Late Cretaceous combined with very patchy regional sampling means that it is possible neornithine lineages were present throughout this interval but have not yet been sampled or are difficult to identify because of the fragmentary nature of the specimens.
Conflict of interest statement
Figures


Similar articles
-
The quality of the fossil record of Mesozoic birds.Proc Biol Sci. 2005 Feb 7;272(1560):289-94. doi: 10.1098/rspb.2004.2923. Proc Biol Sci. 2005. PMID: 15705554 Free PMC article.
-
Preservational bias controls the fossil record of pterosaurs.Palaeontology. 2016 Jan 14;59(2):225-247. doi: 10.1111/pala.12225. Palaeontology. 2016. PMID: 27239072 Free PMC article.
-
Bird evolution in the Eocene: climate change in Europe and a Danish fossil fauna.Biol Rev Camb Philos Soc. 2006 Nov;81(4):483-99. doi: 10.1017/S146479310600707X. Epub 2006 Aug 8. Biol Rev Camb Philos Soc. 2006. PMID: 16893476 Review.
-
Testing the effect of the rock record on diversity: a multidisciplinary approach to elucidating the generic richness of sauropodomorph dinosaurs through time.Biol Rev Camb Philos Soc. 2011 Feb;86(1):157-81. doi: 10.1111/j.1469-185X.2010.00139.x. Biol Rev Camb Philos Soc. 2011. PMID: 20412186
-
The Paleogene fossil record of birds in Europe.Biol Rev Camb Philos Soc. 2005 Nov;80(4):515-42. doi: 10.1017/S1464793105006779. Biol Rev Camb Philos Soc. 2005. PMID: 16221327 Review.
Cited by
-
New information on paleopathologies in non-avian theropod dinosaurs: a case study on South American abelisaurids.BMC Ecol Evol. 2024 Jan 31;24(1):6. doi: 10.1186/s12862-023-02187-x. BMC Ecol Evol. 2024. PMID: 38291378 Free PMC article.
-
Whence the birds: 200 years of dinosaurs, avian antecedents.Biol Lett. 2025 Jan;21(1):20240500. doi: 10.1098/rsbl.2024.0500. Epub 2025 Jan 22. Biol Lett. 2025. PMID: 39837495 Free PMC article. Review.
-
How has our knowledge of dinosaur diversity through geologic time changed through research history?PeerJ. 2018 Feb 19;6:e4417. doi: 10.7717/peerj.4417. eCollection 2018. PeerJ. 2018. PMID: 29479504 Free PMC article.
-
Tip dating and Bayes factors provide insight into the divergences of crown bird clades across the end-Cretaceous mass extinction.Proc Biol Sci. 2024 Feb 14;291(2016):20232618. doi: 10.1098/rspb.2023.2618. Epub 2024 Feb 14. Proc Biol Sci. 2024. PMID: 38351798 Free PMC article.
-
The skeletal completeness of the Palaeozoic chondrichthyan fossil record.R Soc Open Sci. 2024 Jan 31;11(1):231451. doi: 10.1098/rsos.231451. eCollection 2024 Jan. R Soc Open Sci. 2024. PMID: 38298400 Free PMC article.
References
-
- Gill FB. Ornithology. New York: W. H. Freeman and Company. 660 p. 1990.
-
- Chatterjee S. The Rise of Birds. Baltimore and London: The John Hopkins University Press. 312 p. 1997.
-
- Chiappe LM. The first 85 million years of avian evolution. Nature. 1995;391:147–152.
-
- Witmer L. Chiappe LM, Witmer LM, editors. The debate on avian ancestry: phylogeny, function and fossils. 2002. pp. 3–30. Mesozoic birds: Above the Heads if Dinosaurs. Berkeley, California: University of California Press.
-
- Cracraft J. Phylogeny and evolution of the ratite birds. Ibis. 1971;116:494–521.
MeSH terms
LinkOut - more resources
Full Text Sources
