

Genome-wide bovine H3K27me3 modifications and the regulatory effects on genes expressions in peripheral blood lymphocytes
- PMID: 22761725
- PMCID: PMC3386284
- DOI: 10.1371/journal.pone.0039094
Genome-wide bovine H3K27me3 modifications and the regulatory effects on genes expressions in peripheral blood lymphocytes
Abstract
Background: Gene expression of lymphocytes was found to be influenced by histone methylation in mammals and trimethylation of lysine 27 on histone H3 (H3K27me3) normally represses genes expressions. Peripheral blood lymphocytes are the main source of somatic cells in the milk of dairy cows that vary frequently in response to the infection or injury of mammary gland and number of parities.
Methods: The genome-wide status of H3K27me3 modifications on blood lymphocytes in lactating Holsteins was performed via ChIP-Seq approach. Combined with digital gene expression (DGE) technique, the regulation effects of H3K27me3 on genes expressions were analyzed.
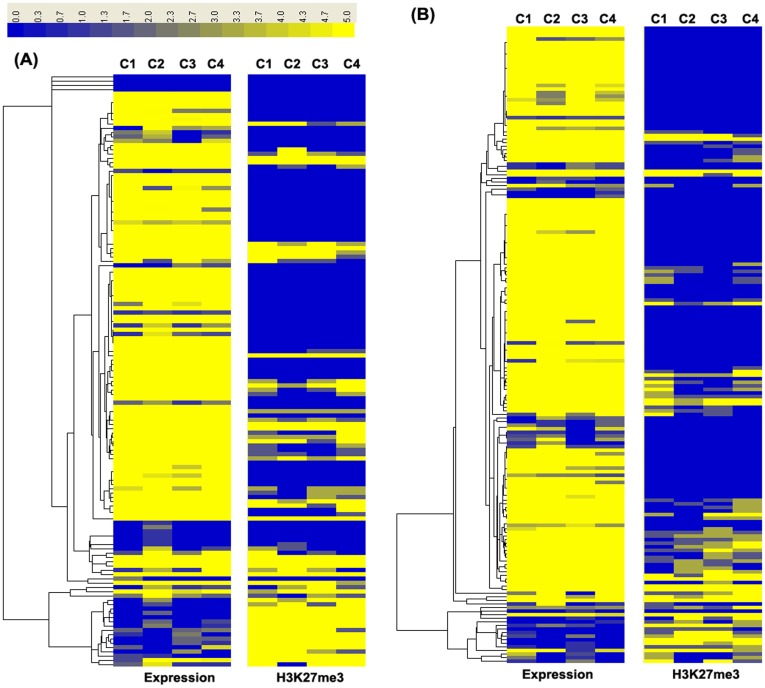
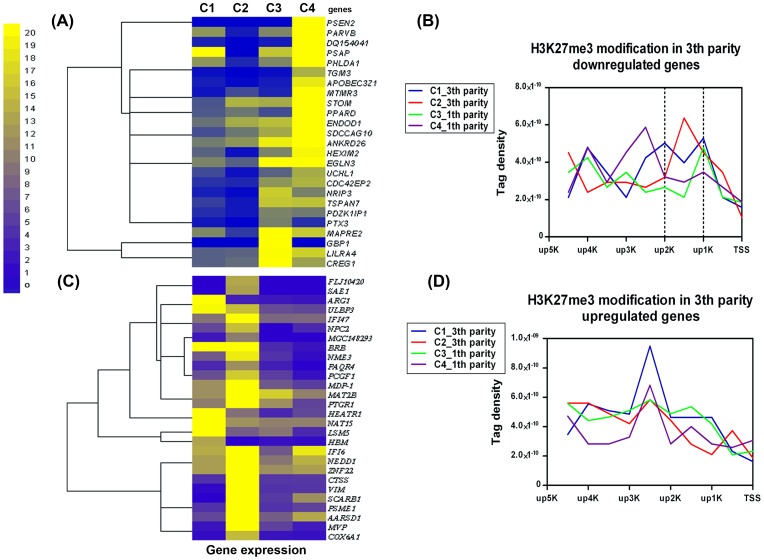
Results: The ChIP-seq results showed that the peaks of H3K27me3 in cows lymphocytes were mainly enriched in the regions of up20K (~50%), down20K (~30%) and intron (~28%) of the genes. Only ~3% peaks were enriched in exon regions. Moreover, the highest H3K27me3 modification levels were mainly around the 2 Kb upstream of transcriptional start sites (TSS) of the genes. Using conjoint analysis with DGE data, we found that H3K27me3 marks tended to repress target genes expressions throughout whole gene regions especially acting on the promoter region. A total of 53 differential expressed genes were detected in third parity cows compared to first parity, and the 25 down-regulated genes (PSEN2 etc.) were negatively correlated with H3K27me3 levels on up2Kb to up1Kb of the genes, while the up-regulated genes were not showed in this relationship.
Conclusions: The first blueprint of bovine H3K27me3 marks that mediates gene silencing was generated. H3K27me3 plays its repressed role mainly in the regulatory region in bovine lymphocytes. The up2Kb to up1Kb region of the down-regulated genes in third parity cows could be potential target of H3K27me3 regulation. Further studies are warranted to understand the regulation mechanisms of H3K27me3 on somatic cell count increases and milk losses in latter parities of cows.
Conflict of interest statement
Figures


Similar articles
-
Whole-genome regulation analysis of histone H3 lysin 27 trimethylation in subclinical mastitis cows infected by Staphylococcus aureus.BMC Genomics. 2016 Aug 8;17:565. doi: 10.1186/s12864-016-2947-0. BMC Genomics. 2016. PMID: 27503467 Free PMC article.
-
Genome-wide mapping of histone H3 lysine 4 trimethylation in Eucalyptus grandis developing xylem.BMC Plant Biol. 2015 May 10;15:117. doi: 10.1186/s12870-015-0499-0. BMC Plant Biol. 2015. PMID: 25957781 Free PMC article.
-
ChIP-seq analysis reveals distinct H3K27me3 profiles that correlate with transcriptional activity.Nucleic Acids Res. 2011 Sep 1;39(17):7415-27. doi: 10.1093/nar/gkr416. Epub 2011 Jun 7. Nucleic Acids Res. 2011. PMID: 21652639 Free PMC article.
-
Distinct features of H3K4me3 and H3K27me3 chromatin domains in pre-implantation embryos.Nature. 2016 Sep 22;537(7621):558-562. doi: 10.1038/nature19362. Epub 2016 Sep 14. Nature. 2016. PMID: 27626379
-
H3K27me3 forms BLOCs over silent genes and intergenic regions and specifies a histone banding pattern on a mouse autosomal chromosome.Genome Res. 2009 Feb;19(2):221-33. doi: 10.1101/gr.080861.108. Epub 2008 Dec 1. Genome Res. 2009. PMID: 19047520 Free PMC article.
Cited by
-
Whole-genome regulation analysis of histone H3 lysin 27 trimethylation in subclinical mastitis cows infected by Staphylococcus aureus.BMC Genomics. 2016 Aug 8;17:565. doi: 10.1186/s12864-016-2947-0. BMC Genomics. 2016. PMID: 27503467 Free PMC article.
-
Epigenetic marks: regulators of livestock phenotypes and conceivable sources of missing variation in livestock improvement programs.Front Genet. 2015 Sep 28;6:302. doi: 10.3389/fgene.2015.00302. eCollection 2015. Front Genet. 2015. PMID: 26442116 Free PMC article. Review.
-
Polycomb-mediated gene silencing in Arabidopsis thaliana.Mol Cells. 2014 Dec 31;37(12):841-50. doi: 10.14348/molcells.2014.0249. Epub 2014 Nov 20. Mol Cells. 2014. PMID: 25410906 Free PMC article. Review.
-
Combined analysis of DNA methylome and transcriptome reveal novel candidate genes with susceptibility to bovine Staphylococcus aureus subclinical mastitis.Sci Rep. 2016 Jul 14;6:29390. doi: 10.1038/srep29390. Sci Rep. 2016. PMID: 27411928 Free PMC article.
-
Genome-Wide H3K4me3 Analysis in Angus Cattle with Divergent Tenderness.PLoS One. 2015 Jun 18;10(6):e0115358. doi: 10.1371/journal.pone.0115358. eCollection 2015. PLoS One. 2015. PMID: 26086782 Free PMC article.
References
-
- Hare E, Norman HD, Wright JR. Survival rates and productive herd life of dairy cattle in the United States. J Dairy Sci. 2006;89:3713–3720. - PubMed
-
- Caraviello DZ, Weigel KA, Shook GE, Ruegg PL. Assessment of the impact of somatic cell count on functional longevity in Holstein and Jersey cattle using survival analysis methodology. J Dairy Sci. 2005;88:804–811. - PubMed
-
- Hultgren J, Svensson C. Lifetime risk and cost of clinical mastitis in dairy cows in relation to heifer rearing conditions in southwest Sweden. J Dairy Sci. 2009;92:3274–3280. - PubMed
-
- Hultgren J, Svensson C. Heifer rearing conditions affect length of productive life in Swedish dairy cows. Prev Vet Med. 2009;89:255–264. - PubMed
-
- ten Napel J, de Haas Y, de Jong G, Lam TJ, Ouweltjes W, et al. Characterization of distributions of somatic cell counts. J Dairy Sci. 2009;92:1253–1264. - PubMed
Publication types
MeSH terms
Substances
LinkOut - more resources
Full Text Sources
