. 2012;7(6):e39251.
doi: 10.1371/journal.pone.0039251. Epub 2012 Jun 27.

Detection of ligation products of DNA linkers with 5'-OH ends by denaturing PAGE silver stain

Affiliations

Detection of ligation products of DNA linkers with 5'-OH ends by denaturing PAGE silver stain

Feng Gao et al. PLoS One. 2012.

Abstract

To explore if DNA linkers with 5'-hydroxyl (OH) ends could be joined by commercial T4 and E. coli DNA ligase, these linkers were synthesized by using the solid-phase phosphoramidite method and joined by using commercial T4 and E. coli DNA ligases. The ligation products were detected by using denaturing PAGE silver stain and PCR method. About 0.5-1% of linkers A-B and E-F, and 0.13-0.5% of linkers C-D could be joined by T4 DNA ligases. About 0.25-0.77% of linkers A-B and E-F, and 0.06-0.39% of linkers C-D could be joined by E. coli DNA ligases. A 1-base deletion (-G) and a 5-base deletion (-GGAGC) could be found at the ligation junctions of the linkers. But about 80% of the ligation products purified with a PCR product purification kit did not contain these base deletions, meaning that some linkers had been correctly joined by T4 and E. coli DNA ligases. In addition, about 0.025-0.1% of oligo 11 could be phosphorylated by commercial T4 DNA ligase. The phosphorylation products could be increased when the phosphorylation reaction was extended from 1 hr to 2 hrs. We speculated that perhaps the linkers with 5'-OH ends could be joined by T4 or E. coli DNA ligase in 2 different manners: (i) about 0.025-0.1% of linkers could be phosphorylated by commercial T4 DNA ligase, and then these phosphorylated linkers could be joined to the 3'-OH ends of other linkers; and (ii) the linkers could delete one or more nucleotide(s) at their 5'-ends and thereby generated some 5'-phosphate ends, and then these 5'-phosphate ends could be joined to the 3'-OH ends of other linkers at a low efficiency. Our findings may probably indicate that some DNA nicks with 5'-OH ends can be joined by commercial T4 or E. coli DNA ligase even in the absence of PNK.


Conflict of interest statement

Competing Interests: The authors have declared that no competing interests exist.

Figures

Figure 1
Figure 1. Schematic diagram of linkers A–B, C–D and the three-round overlap PCR primers.
The arrows represent PCR primers. The sequences of linkers and PCR primers are listed in Tables 1 and 2, respectively. (A) Linkers A–B and PCR primers. (B) Linkers C–D and PCR primers.
Figure 2
Figure 2. 12% denaturing PAGE for the ligation products of linkers A–B, C–D, and E–F.
PAGE (10×10×0.03 cm, A:B = 19∶1, 7 M urea and 0.5 x TBE) was run in 0.5 x TBE, 25°C, 200 V for 1.7 hrs for the ligation products of linkers A–B and C–D, or 100 V for 3.5 hrs for those of linkers E–F. The arrows indicate the ligation products. Lane M: DNA marker I (GeneRuler™ 50 bp DNA ladder, Fermentas); Lane M1: DNA marker I +1 µl of 1 µM oligo 15; Lane M2: pUC19 DNA/MspI Marker (Fermentas). (A) The ligation products joined by using T4 DNA ligase from Takara and Fermentas. Lane 1∶1 µl of 1 µM oligo 15; Lanes 2 and 6: the ligation products of linkers A–B joined by using T4 DNA ligase from Takara and Fermentas, respectively. We could see 5 bands. Of them, bands 1 and 2 were from oligos 4 and 1, respectively. Band 3 was from both oligos 2 and 3. Band 4 was unknown. Perhaps it might be the intermixtures of oligos 1–4. Band 5 was the denatured ligation products of linkers A–B; Lanes 4 and 8: the ligation products of linkers C–D joined by using T4 DNA ligase from Takara and Fermentas, respectively. We could see 4 bands. Of them, bands 6 and 7 were from both oligos 6 and 7, and both oligos 5 and 8, respectively. Band 8 was the denatured ligation products of linkers C–D. Band 9 was unknown. Perhaps it might be the intermixtures of oligos 5–8 and the double-strand ligation products of linkers C–D; Lanes 3, 5, 7, and 9: the negative controls. (B) The ligation products of linkers A–B and C–D joined by using T4 DNA ligase from Promega and the ligation products of linkers A–B joined in the ligase reaction mixture containing (NH4)2SO4. Lane 1∶1 µl of 1 µM oligo 15; Lanes 2 and 4: the denatured ligation products of linkers A–B, and C–D, respectively. T4 DNA ligase was from Promega; Lanes 6 and 7: the ligation products of linkers A–B joined in the ligase reaction mixture without (NH4)2SO4 and with (NH4)2SO4, respectively. T4 DNA ligase used was from Takara; Lanes 3, 5, and 8: the negative controls. (C) The ligation products of linkers A–B and C–D joined by using E. coli DNA ligase. Lane 1∶1 µl of 1 µM oligo 15; Lanes 2 and 4: the ligation products of linkers A–B, and C–D, respectively; Lanes 3 and 5: the negative controls. (D) The ligation products of linkers E–F joined in the ligase reaction mixture with (NH4)2SO4. The ligase was T4 DNA ligase (Fermentas). Lane 1: pUC19 DNA/MspI Marker plus 2 µl of ligation products of linkers E–F; Lanes 2 and 3: the ligation products of linkers E–F joined in the ligase reaction mixtures with (NH4)2SO4, and without (NH4)2SO4, respectively. We could see 3 bands. Bands 10 and 11 are from both oligos 9 and 12, and both oligos 10 and 11, respectively; Band 12 is the ligation products of linkers E–F; Lane 4: the negative control. (E) The ligation products of linkers E–F joined by using E. coli DNA ligase. Lane 1: the ligation products of linkers E–F. Lane 2: the negative control. (F) The ligation products of linkers A–B preincubated with T4 PNK in the E. coli DNA ligase reaction mixture without ATP. The ligase was E. coli DNA ligase (Takara). Lane 1∶1 µl of 1 µM oligo 15; Lane 2: linkers A–B were not preincubated with T4 PNK; Lane 3: linkers A–B were preincubated with T4 PNK; Lane 4: the negative control.
Figure 3
Figure 3. 15% denaturing PAGE for the ligation products of linkers A–B, C–D and linkers G–H.
PAGE (10×10×0.03 cm, A:B = 29∶1, 7 M urea, 0.5x TBE) was run in 0.5 x TBE, 25°C, 100 V for 3.5 hrs in (A)–(F), or 4.3 hrs in (G). The ligation products were indicated by the arrows. Lane M: DNA marker I (GeneRuler™ 50 bp DNA ladder, Fermentas). Lane M1: DNA marker I plus oligo 15. (A) The ligation products joined by using T4 DNA ligase from Fermentas. Lane 1: the ligation products of linkers C–D preincubated with T4 DNA ligase; Lane 2: the ligation products of linkers C–D without the preincubation; Lane 4: the ligation products of linkers A–B; Lanes 3 and 5: the negative controls. (B) The ligation products joined by using T4 DNA ligase from Takara. Lanes 1–3∶0.5, 1, and 2 µl of 1 µM oligo 15, respectively; Lanes 4 and 6: the ligation products of linkers A–B; Lane 8: the ligation products of linkers C–D. Lanes 5, 7, and 9: the negative controls. (C) The ligation products joined by using T4 DNA ligase from Promega. Lane 1∶1 µl of 1 µM oligo 15; Lanes 2 and 4: ligation products of linkers A–B, and C–D, respectively; Lanes 3 and 5: the negative controls. (D) The ligation products joined by using E. coli DNA ligase from Takara. Lanes 1 and 3: the ligation products of linkers A–B, and C–D, respectively; Lanes 2 and 4: the negative controls. (E) The ligation products of linkers A–B joined in T4 DNA ligase reaction mixture containing (NH4)2SO4. Lanes 1–3: the ligase reaction mixture with 7.5 mM (NH4)2SO4, 3.75 mM (NH4)2SO4, and without (NH4)2SO4, respectively; Lane 4: the negative control. (F) The ligation products of the phosphorylated linkers A–B and C–D joined by using T4 and E. coli DNA ligase (Takara). Lane 1∶1 µl of 1 µM oligo 15; Lanes 2 and 4: the ligation products of the phosphorylated linkers A–B joined by using T4 and E. coli DNA ligase, respectively; Lanes 3 and 5: the ligation products of the phosphorylated linkers C–D joined by using T4 and E. coli DNA ligase, respectively; Lanes 6 and 7: the ligation products of linkers A–B and C–D, respectively; Lanes 8 and 9: the negative controls of lanes 6 and 7, respectively. (G) The ligation products of linkers A–B and the phosphorylated linkers G–H. Lanes 1 and 2: the ligation products of linkers A–B and the ligation products of the phosphorylated linkers G–H plus the negative control of linkers A–B, respectively; Lane 3: the negative control of linkers G–H plus the negative control of linkers A–B. The band from the ligation products of the phosphorylated linkers G–H run a little more slowly than that of linkers A–B. The sequences of linkers G and H are similar to those of linkers A and B, respectively. But there is a 1-base deletion at the 5′ end of each of linkers G and H.
Figure 4
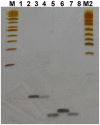
Figure 4. 15% denaturing PAGE for oligos 1–8.
PAGE (10×10×0.03 cm, A:B = 29∶1, 7 M urea, 0.5 x TBE) was run in 0.5 x TBE buffer at 25°C and 100 V for 3.5 hrs. The silver stain method was described in the text. Lanes M and M2: DNA marker I (GeneRuler™ 50 bp DNA ladder, Fermentas) and pUC19 DNA/MspI Marker (Fermentas), respectively. Lanes 1–8: oligos 2, 3, 5, 8, 4, 1, 6, and 7, respectively. Of them, oligos 2, 3, and 7 could not be fixed with 50% methanol containing 10% acetic acid and silver-stained.
Figure 5
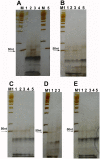
Figure 5. 12% denaturing PAGE for the ligation products of linkers A–B treated with CIAP.
PAGE (10×10×0.03 cm, A:B  = 19∶1, 7 M urea and 0.5 x TBE) was run in 0.5 x TBE, 25°C, 200 V for 1.7 hrs. The arrows indicate the ligation products. Lane M: DNA marker I (GeneRuler™ 50 bp DNA ladder, Fermentas); Lane M1: DNA marker I +1 µl of 1 µM oligo 15. The ligases used in (A)–(C) were T4 DNA ligases. The ligases used in (D)–(E) were E. coli DNA ligases. (A) CIAP was inactivated at 75°C for 15 min. Lanes 1 and 5∶1 µl of 1 µM oligo 15; Lanes 2: CIAP was inactivated at 75°C for 15 min; Lane 3: the positive control without CIAP treatment; Lane 4: the negative control without ligase. (B) CIAP was inactivated at 85°C for 25 min and 45 min. Lanes 1 and 3: the positive controls without CIAP treatment; Lanes 2 and 4: CIAP was inactivated at 85°C for 25 min and 45 min, respectively; Lane 5: the negative control without ligase. (C) CIAP was inactivated at 85°C for 65 min and 90 min. Lanes 1 and 3: the positive controls without CIAP treatment; Lanes 2 and 4: CIAP was inactivated at 85°C for 65 min and 90 min, respectively; Lane 5: the negative control without ligase. (D) CIAP was inactivated at 85°C for 45 min. Lanes 1 and 3: the positive control without CIAP treatment and the negative control without ligase, respectively; Lane 2: CIAP was inactivated at 85°C for 45 min. (E) CIAP was inactivated at 85°C for 65 and 90 min. Lanes 1 and 3: the positive controls without CIAP treatment; Lanes 2 and 4: CIAP was inactivated at 85°C for 65 and 90 min, respectively; Lane 5: the negative control without ligase.
Figure 6
Figure 6. 2.5% agarose gel electrophoreses for the three round PCR products.
Electrophoreses were run in 1 x TAE at 60 V for 40 min. Lanes M and M2: DNA marker I and pUC19 DNA/MspI Marker, respectively; Lanes 1, 3, and 5: the first, second, and third round PCR products, respectively; Lanes 2, 4, and 6: the negative controls. (A) and (B)The first round PCR templates were the ligation products of linkers A–B joined by T4 and E. coli DNA ligases, respectively. (C) and (D) The first round PCR templates were the ligation products of linkers C–D joined by T4 and E. coli DNA ligases, respectively. (E) The first round PCR templates were the ligation products cut from the denaturing PAGE gel.
Figure 7
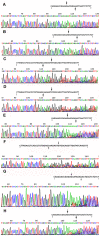
Figure 7. DNA sequencing results of the third round PCR products.
The letters on the top are the expected DNA sequences. The downward arrows and the upward arrows indicate the ligation junctions of the sense strands and the antisense strands, respectively. (A) and (B) The sequencing templates were prepared from the ligation products of linkers A–B joined by T4 and E. coli DNA ligases, respectively. The ligation products were purified by using a PCR product purification kit before PCR. There was a 1-base deletion (-G) at the ligation junctions of both sense and antisense strands. The signal intensity from these deletions was only equivalent to about 25% of that from the normal sequences. (C) and (D) The sequencing templates were prepared from the ligation products of linkers C–D by T4 and E. coli DNA ligases, respectively. The ligation products were purified by using a PCR product purification kit before PCR. A 5-base deletion (-GGAGC) was found at the ligation junction of the antisense strand. The signal intensity from the deletion was only equivalent to about 25% of that from the normal sequence. (E) and (F) DNA sequencing template was prepared from the unpurified ligation products of linkers A–B and C–D, respectively. A 1-base deletion (-G) or a 5-base deletion (-GGAGC) was found at the ligation junctions of both sense and antisense strands of linkers A–B, or the ligation junction of the antisense strand of linkers C–D, respectively. The signal intensity from these deletions was equivalent to or even stronger than that from the normal sequence. (G) DNA sequencing template was prepared from the ligation products of linkers A–B cut from the denaturing PAGE gel. There was a 1-base deletion (-G) at the ligation junctions of both sense and antisense strands. (H) DNA sequencing template was prepared from the negative control of linkers A–B cut from the denaturing PAGE gel. There was 1-base deletion (-G) at the ligation junctions of both sense and antisense strands.
Figure 8
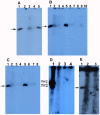
Figure 8. The radioautograph of oligo 11 phosphorylated by T4 DNA ligase.
The oligo 11 was phosphorylated by using commercial T4 DNA ligase. The phosphorylation products were loaded on a 15% denaturing PAGE gel (10×10×0.03 cm, A:B  = 29∶1, 7 M urea, 0.5 x TBE). Electrophoresis was run in 0.5 x TBE at 100 V and 25°C for 3 hrs. The gel was dried between two semipermeable cellulose acetate membranes and radioautographed at −20°C for 1–3 days. The arrows indicate the phosphorylation products. The positive controls were oligo 11 phosphorylated by T4 PNK. (A) Oligo 11 was phosphorylated by T4 DNA ligase at 37°C for 2 hrs. Lanes 1 and 5: the positive controls; Lanes 2 and 4: the negative controls without ligase, and without oligo 11, respectively; Lane 3: the phosphorylation products of oligo 11 by T4 DNA ligase. (B) Oligo 11 treated with CIAP was phosphorylated by T4 DNA ligase at 37°C for 2 hrs. Lanes 1 and 5: the positive controls; Lane 2: the phosphorylation products of oligo 11 by T4 DNA ligase; Lanes 3 and 4: the negative controls without ligase, and without oligo 11, respectively; Lanes 6, 7, and 8: oligo 11 treated with CIAP was phosphorylated by T4 DNA ligase. CIAP was inactivated at 85°C for 15 min, 30 min, and 60 min, respectively. Lanes 9 and 10: the negative controls without ligase, and without oligo 11, respectively. (C) Oligo 11 treated with CIAP was phosphorylated by T4 DNA ligase at 37°C for 2 hrs. Lanes 1 and 5: the positive controls; Lane 2: the phosphorylation products of oligo 11 by T4 DNA ligase; Lanes 3 and 4: the negative controls without ligase, and without oligo 11, respectively; Lanes 6, 7, and 8: oligo 11 treated with CIAP was phosphorylated by T4 DNA ligase. CIAP was inactivated at 85°C for 60 min, 15 min, and 30 min, respectively. (D) Oligos 11 and 12 were phosphorylated by T4 DNA ligase at 37°C for 1 hr. Lane 1: oligos 11 and 12 were phosphorylated by T4 PNK; Lane 2: oligos 11 and 12 were phosphorylated by T4 DNA ligase; Lane 3: oligo 11 were phosphorylated by T4 DNA ligase; Lane 4: the negative control without ligase. (E) Oligo 11 was phosphorylated by T4 DNA ligase at 37°C for 2 hrs. 1 x TE and 10% SDS were not added to the phosphorylation products before phenol/chloroform extraction. Lane 1: the positive control; Lanes 2 and 3: the phosphorylation products of oligo 11 by T4 DNA ligase and the negative controls without ligase, respectively.
Figure 9
Figure 9. 2.5% agarose gel electrophoresis for the ligation products of linkers A–B and C–D.
The gel contained 0.5 µg/ml of EB. 20 µl of the original ligation products were loaded to each well. Electrophoresis was run in 1 x TAE, at 60 V for 40 min. Lane M: DNA marker I; Lanes 1 and 3: the ligation products of linkers A–B, and C–D, respectively. Lanes 2 and 4: the negative controls of lanes 1 and 3, respectively.

Similar articles

Cited by

References

    1. Lehman IR. DNA ligase: structure, mechanism, and function. Science. 1974;186:790–797. - PubMed
    1. Timson DJ, Singleton MR, Wigley DB. DNA ligases in the repair and replication of DNA. Mutat Res. 2000;460:301–318. - PubMed
    1. Doherty AJ, Suh SW. Structural and mechanistic conservation in DNA ligases. Nucleic Acids Res. 2000;28:4051–4058. - PMC - PubMed
    1. Cheng C, Shuman S. Characterization of an ATP-dependent DNA ligase encoded by Haemophilus influenza. Nucleic Acids Res. 1997;25:1369–1374. - PMC - PubMed
    1. Wilkinson A, Day J, Bowater R. Bacterial DNA ligases. Mol Microbiol. 2001;40:1241–1248. - PubMed

Publication types