Human peripheral blood mononuclear cells exhibit heterogeneous CD52 expression levels and show differential sensitivity to alemtuzumab mediated cytolysis
- PMID: 22761788
- PMCID: PMC3382607
- DOI: 10.1371/journal.pone.0039416
Human peripheral blood mononuclear cells exhibit heterogeneous CD52 expression levels and show differential sensitivity to alemtuzumab mediated cytolysis
Abstract
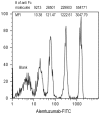
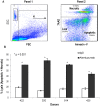
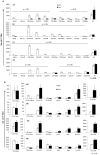
Alemtuzumab is a monoclonal antibody that targets cell surface CD52 and is effective in depleting lymphocytes by cytolytic effects in vivo. Although the cytolytic effects of alemtuzumab are dependent on the density of CD52 antigen on cells, there is scant information regarding the expression levels of CD52 on different cell types. In this study, CD52 expression was assessed on phenotypically distinct subsets of lymphoid and myeloid cells in peripheral blood mononuclear cells (PBMCs) from normal donors. Results demonstrate that subsets of PBMCs express differing levels of CD52. Quantitative analysis showed that memory B cells and myeloid dendritic cells (mDCs) display the highest number while natural killer (NK) cells, plasmacytoid dendritic cells (pDCs) and basophils have the lowest number of CD52 molecules per cell amongst lymphoid and myeloid cell populations respectively. Results of complement dependent cytolysis (CDC) studies indicated that alemtuzumab mediated profound cytolytic effects on B and T cells with minimal effect on NK cells, basophils and pDCs, correlating with the density of CD52 on these cells. Interestingly, despite high CD52 levels, mDCs and monocytes were less susceptible to alemtuzumab-mediated CDC indicating that antigen density alone does not define susceptibility. Additional studies indicated that higher expression levels of complement inhibitory proteins (CIPs) on these cells partially contributes to their resistance to alemtuzumab mediated CDC. These results indicate that alemtuzumab is most effective in depleting cells of the adaptive immune system while leaving innate immune cells relatively intact.
Conflict of interest statement
Figures


Similar articles
-
CD52-Negative NK Cells Are Abundant in the Liver and Less Susceptible to Alemtuzumab Treatment.PLoS One. 2016 Aug 25;11(8):e0161618. doi: 10.1371/journal.pone.0161618. eCollection 2016. PLoS One. 2016. PMID: 27560943 Free PMC article.
-
Ex vivo-expanded cynomolgus macaque regulatory T cells are resistant to alemtuzumab-mediated cytotoxicity.Am J Transplant. 2013 Aug;13(8):2169-78. doi: 10.1111/ajt.12248. Epub 2013 May 1. Am J Transplant. 2013. PMID: 23635093 Free PMC article.
-
The effects of CAMPATH-1H on cell viability do not correlate to the CD52 density on the cell surface.PLoS One. 2014 Jul 22;9(7):e103254. doi: 10.1371/journal.pone.0103254. eCollection 2014. PLoS One. 2014. PMID: 25050704 Free PMC article.
-
Alemtuzumab for the prevention and treatment of graft-versus-host disease.Int J Hematol. 2011 May;93(5):586-593. doi: 10.1007/s12185-011-0802-2. Epub 2011 Mar 3. Int J Hematol. 2011. PMID: 21369856 Review.
-
Alemtuzumab in the treatment of chronic lymphocytic leukemia.BioDrugs. 2005;19(1):9-22. doi: 10.2165/00063030-200519010-00002. BioDrugs. 2005. PMID: 15691213 Review.
Cited by
-
Long-term efficacy and safety of alemtuzumab in participants with highly active MS: TOPAZ clinical trial and interim analysis of TREAT-MS real-world study.Ther Adv Neurol Disord. 2025 Feb 10;18:17562864241306575. doi: 10.1177/17562864241306575. eCollection 2025. Ther Adv Neurol Disord. 2025. PMID: 39935588 Free PMC article.
-
Alemtuzumab for the treatment of multiple sclerosis.Ther Clin Risk Manag. 2015 Mar 31;11:525-34. doi: 10.2147/TCRM.S80112. eCollection 2015. Ther Clin Risk Manag. 2015. PMID: 25848299 Free PMC article. Review. No abstract available.
-
Role of Viruses in the Pathogenesis of Multiple Sclerosis.Viruses. 2020 Jun 13;12(6):643. doi: 10.3390/v12060643. Viruses. 2020. PMID: 32545816 Free PMC article. Review.
-
Alemtuzumab in multiple sclerosis: latest evidence and clinical prospects.Ther Adv Chronic Dis. 2013 May;4(3):97-103. doi: 10.1177/2040622313479137. Ther Adv Chronic Dis. 2013. PMID: 23634277 Free PMC article.
-
Alemtuzumab in the treatment of multiple sclerosis: key clinical trial results and considerations for use.Ther Adv Neurol Disord. 2015 Jan;8(1):31-45. doi: 10.1177/1756285614563522. Ther Adv Neurol Disord. 2015. PMID: 25584072 Free PMC article. Review.
References
-
- Hale G. Cd52 (Campath1). J Biol Regul Homeost Agents. 2001;15:386–391. - PubMed
-
- Hale G, Rye PD, Warford A, Lauder I, Brito-Babapulle A. The glycosylphosphatidylinositol-anchored lymphocyte antigen CDw52 is associated with the epididymal maturation of human spermatozoa. J Reprod Immunol. 1993;23:189–205. - PubMed
-
- Riechmann L, Clark M, Waldmann H, Winter G. Reshaping human antibodies for therapy. Nature. 1988;332:323–327. - PubMed
-
- Hale G. Synthetic peptide mimotope of the CAMPATH-1 (CD52) antigen, a small glycosylphosphatidylinositol-anchored glycoprotein. Immunotechnology. 1995;1:175–187. - PubMed
MeSH terms
Substances
LinkOut - more resources
Full Text Sources
Other Literature Sources

