Comparative Study
. 2012;7(6):e39492.
doi: 10.1371/journal.pone.0039492. Epub 2012 Jun 25.

Simulation vs. reality: a comparison of in silico distance predictions with DEER and FRET measurements

Affiliations
Comparative Study

Simulation vs. reality: a comparison of in silico distance predictions with DEER and FRET measurements

Daniel Klose et al. PLoS One. 2012.

Abstract

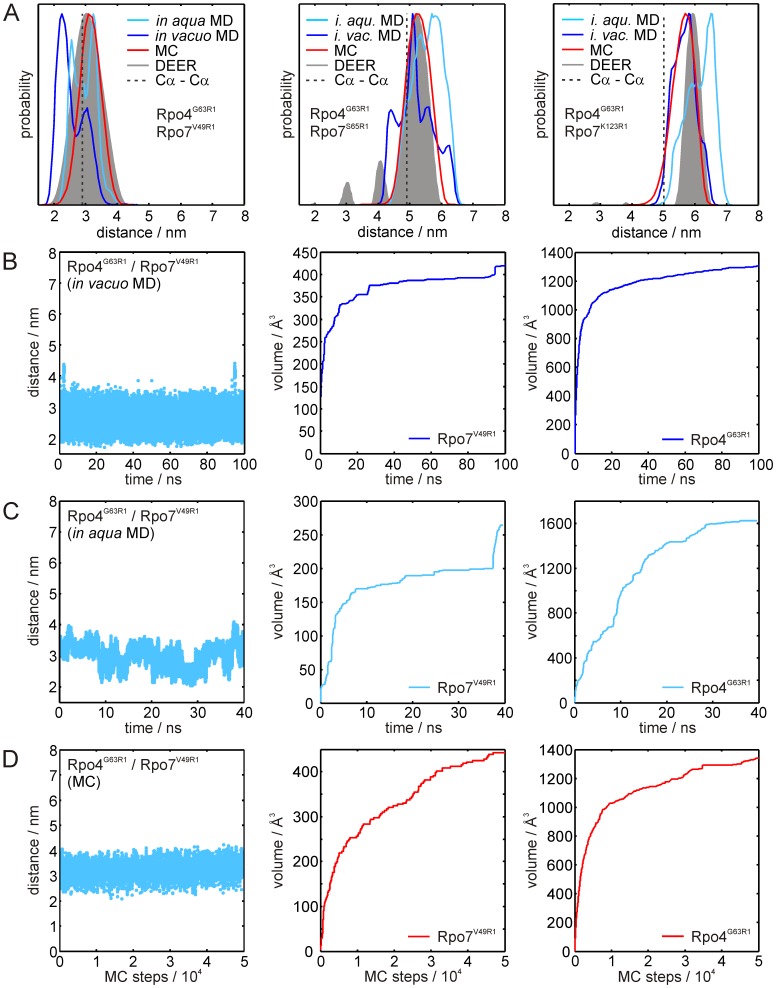
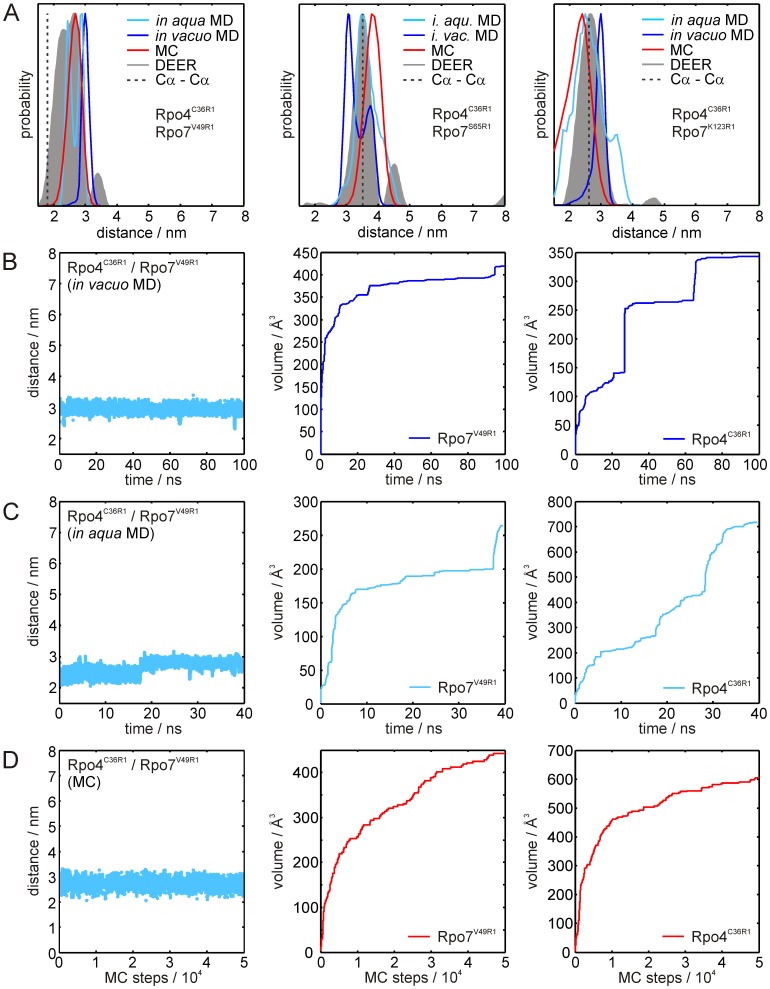
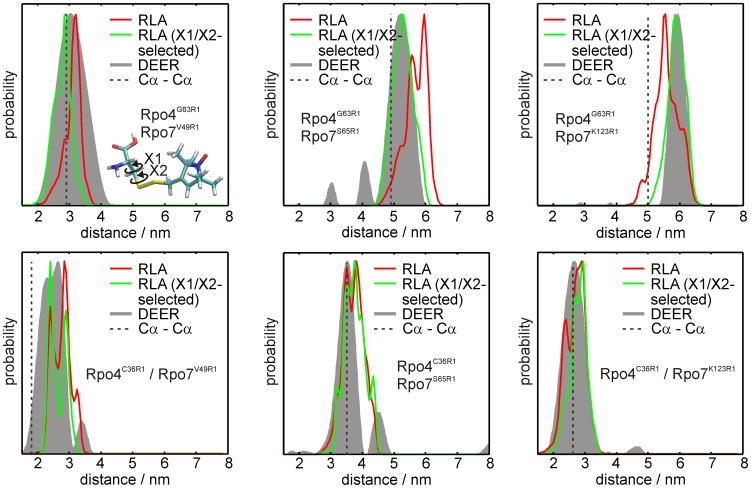
Site specific incorporation of molecular probes such as fluorescent- and nitroxide spin-labels into biomolecules, and subsequent analysis by Förster resonance energy transfer (FRET) and double electron-electron resonance (DEER) can elucidate the distance and distance-changes between the probes. However, the probes have an intrinsic conformational flexibility due to the linker by which they are conjugated to the biomolecule. This property minimizes the influence of the label side chain on the structure of the target molecule, but complicates the direct correlation of the experimental inter-label distances with the macromolecular structure or changes thereof. Simulation methods that account for the conformational flexibility and orientation of the probe(s) can be helpful in overcoming this problem. We performed distance measurements using FRET and DEER and explored different simulation techniques to predict inter-label distances using the Rpo4/7 stalk module of the M. jannaschii RNA polymerase. This is a suitable model system because it is rigid and a high-resolution X-ray structure is available. The conformations of the fluorescent labels and nitroxide spin labels on Rpo4/7 were modeled using in vacuo molecular dynamics simulations (MD) and a stochastic Monte Carlo sampling approach. For the nitroxide probes we also performed MD simulations with explicit water and carried out a rotamer library analysis. Our results show that the Monte Carlo simulations are in better agreement with experiments than the MD simulations and the rotamer library approach results in plausible distance predictions. Because the latter is the least computationally demanding of the methods we have explored, and is readily available to many researchers, it prevails as the method of choice for the interpretation of DEER distance distributions.


Conflict of interest statement

Competing Interests: The authors have declared that no competing interests exist.

Figures

Figure 1
Figure 1. The model system.
(A) Crystal structure of the Rpo4/7 complex (pdb: 1GO3) with the positions used for labeling indicated by a spacefill representation of the native side chains (green). (B) Structures of a spin label pair (left) and the fluorophore pair used in this study. The arrows indicate where the electronic orbitals are between which inter label distances are measured. In first approximation for spin labels this is the center of the nitroxide N-O bond, for fluorophores the center of the chromophore region.
Figure 2
Figure 2. Influence of temperature on the emission intensity of fluorophores.
Fluorescence emission spectra at 25°C (black line) or 65°C (red line) are shown for Rpo4/7 samples (50 nM) labeled with (A) donor only (Rpo4/Rpo7K123C*A350, excitation at 320 nm), (B) acceptor only (Rpo4G63C*A488/Rpo7, excitation at 493 nm) or (C) donor and acceptor (Rpo4G63C*A488/Rpo7K123C*A350, excitation at 320 nm).
Figure 3
Figure 3. DEER data and distance distributions of doubly spin-labeled Rpo4/7 complexes.
Left: background corrected dipolar evolution data; right: distance distributions obtained by Tikhonov regularization. Red traces in the left panel represent the fits obtained by Tikhonov regularization. In the distance distributions Cα-Cα distances derived from the Rpo4/7 crystal structure (pdb: 1GO3) are indicated by gray dashed lines.
Figure 4
Figure 4. Results of the FRET label simulations.
(A) Distance distributions for the label pairs Rpo4G63C*A488/Rpo7V49C*A350 (left), Rpo4G63C*A488/Rpo7S65C*A350 (center) and Rpo4G63C*A488/Rpo7K123C*A350 (right). Distances obtained from the FRET experiments are indicated by green vertical lines, distance distributions obtained from the MD simulations and the MC samplings are shown in blue and red, respectively. Blue and red vertical lines represent expected FRET distances calculated from the respective simulated distance distributions. Cα-Cα distances obtained from the crystal structure are marked by grey lines. (B) Results of the MD simulation for Rpo4G63C*A488/Rpo7V49C*A350. Left panel: Distance trajectory; center and right panel: Volume sampled by the FRET labels over simulation time for labels Rpo7V49C*A350 and Rpo4G63C*A488, respectively. (C) Results of the MC sampling for Rpo4G63C*A488/Rpo7V49C*A350. Left panel: Distance trajectory; center and right panel: Volume sampled by the FRET labels over the number of MC sampling steps for labels Rpo7V49C*A350 and Rpo4G63C*A488, respectively.
Figure 5
Figure 5. Results of the simulations for spin label pairs Rpo4G63R1/Rpo7xR1.
(A) Distance distributions for the spin label pairs Rpo4G63R1/Rpo7V49R1 (left), Rpo4G63R1/Rpo7S65R1 (center) and Rpo4G63R1/Rpo7K123R1 (right). Distance distributions obtained from the DEER experiments are shown in gray, the results of the in vacuo MD, in aqua MD and MC simulation are shown in dark blue, cyan and red, respectively. Cα-Cα distances obtained from the crystal structure are marked by gray dashed lines. (B) Results of the in vacuo MD simulation for Rpo4G63R1/Rpo7V49R1. Left panel: Distance trajectory; center and right panel: Volume sampled by the spin labels over simulation time for labels Rpo4G63R1 and Rpo7V49R1, respectively. (C) Corresponding results for the in aqua MD simulation. (D) Results of the corresponding MC samplings. For the in vacuo MD simulations and the MC samplings of the other spin label pairs the distance trajectories and volume plots are given in the Supplementary Information, Figure S4. The corresponding data for the in aqua MD simulation are given in Figure S5.
Figure 6
Figure 6. Results of the simulations for spin label pairs Rpo4C36R1/Rpo7xR1.
(A) Distance distributions for the spin label pairs Rpo4C36R1/Rpo7V49R1 (left), Rpo4C36R1/Rpo7S65R1 (center) and Rpo4C36R1/Rpo7K123R1 (right). Distance distributions obtained from the DEER experiments are shown in gray, the results of the in vacuo MD, in aqua MD and MC simulation are shown in dark blue, cyan and red, respectively. Cα-Cα distances obtained from the crystal structure are marked by gray dashed lines. (B) Results of the in vacuo MD simulation for Rpo4C36R1/Rpo7V49R1. Left panel: Distance trajectory; center and right panel: Volume sampled by the spin labels over simulation time for labels Rpo4C36R1 and Rpo7V49R1, respectively. (C) Corresponding results for the in aqua MD simulation. (D) Results of the corresponding MC samplings. For the in vacuo MD simulations and the MC samplings of the other spin label pairs the distance trajectories and volume plots are given in the Supplementary Information, Figure S5. The corresponding data for the in aqua MD simulation are given in Figure S6.
Figure 7
Figure 7. Rotamer library analysis for the spin label pairs in Rpo4/Rpo7.
Distance distributions resulting from the DEER experiments are shown in gray. Simulated distance distributions were obtained from the RLA (red) and from a rotamer selection according to the crystal structures of spin labeled T4 lysozyme (green) . The inset in the upper left panel shows the two dihedral angles X1 and X2 discussed in the text (see also Figure S7).
Figure 8
Figure 8. Label orientation probability distributions.
deduced from in vacuo MD simulations (A), in aqua MD simulations (B) and MC sampling (C) in Rpo4/7 (as magenta/blue ribbons). Clouds envelope 99.5% (gray) and 50% (red) of the total probability. Rotamers (D, depicted as sticks) calculated from a given rotamer library span 99.5% of the population. In aqua MD simulations have not been performed for the fluorophore labels as they are currently computationally to intensive for standard hardware. A pre-calculated FRET-label rotamer library is currently not available.

Similar articles

Cited by

References

    1. Agafonov RV, Negrashov IV, Tkachev YV, Blakely SE, Titus MA, et al. Structural dynamics of the myosin relay helix by time-resolved EPR and FRET. Proc Natl Acad Sci U S A. 2009;106:21625–21630. - PMC - PubMed
    1. Edidin M. Fluorescence resonance energy transfer: techniques for measuring molecular conformation and molecular proximity. Curr Prot Immunol Chapter 18: Unit 18.10. 2003. - PubMed
    1. Schiemann O, Prisner TF. Long-range distance determinations in biomacromolecules by EPR spectroscopy. Q Rev Biophys. 2007;40:1–53. - PubMed
    1. Bordignon E, Steinhoff HJ. Membrane protein structure and dynamics studied by site-directed spin labeling ESR. In ESR Spectroscopy in Membrane Biophysics, Hemminga, M. A., Berliner, L. J., Eds.; New York: Springer Science and Business Media. Pp. 2007. pp. 129–164. - PubMed
    1. Förster T. Transfer mechanisms of electronic excitation. Discuss Faraday Soc. 1959;27:7–17.

Publication types

MeSH terms