. 2012;7(6):e39790.
doi: 10.1371/journal.pone.0039790. Epub 2012 Jun 27.

Regression of atherosclerosis is characterized by broad changes in the plaque macrophage transcriptome

Affiliations

Regression of atherosclerosis is characterized by broad changes in the plaque macrophage transcriptome

Jonathan E Feig et al. PLoS One. 2012.

Abstract

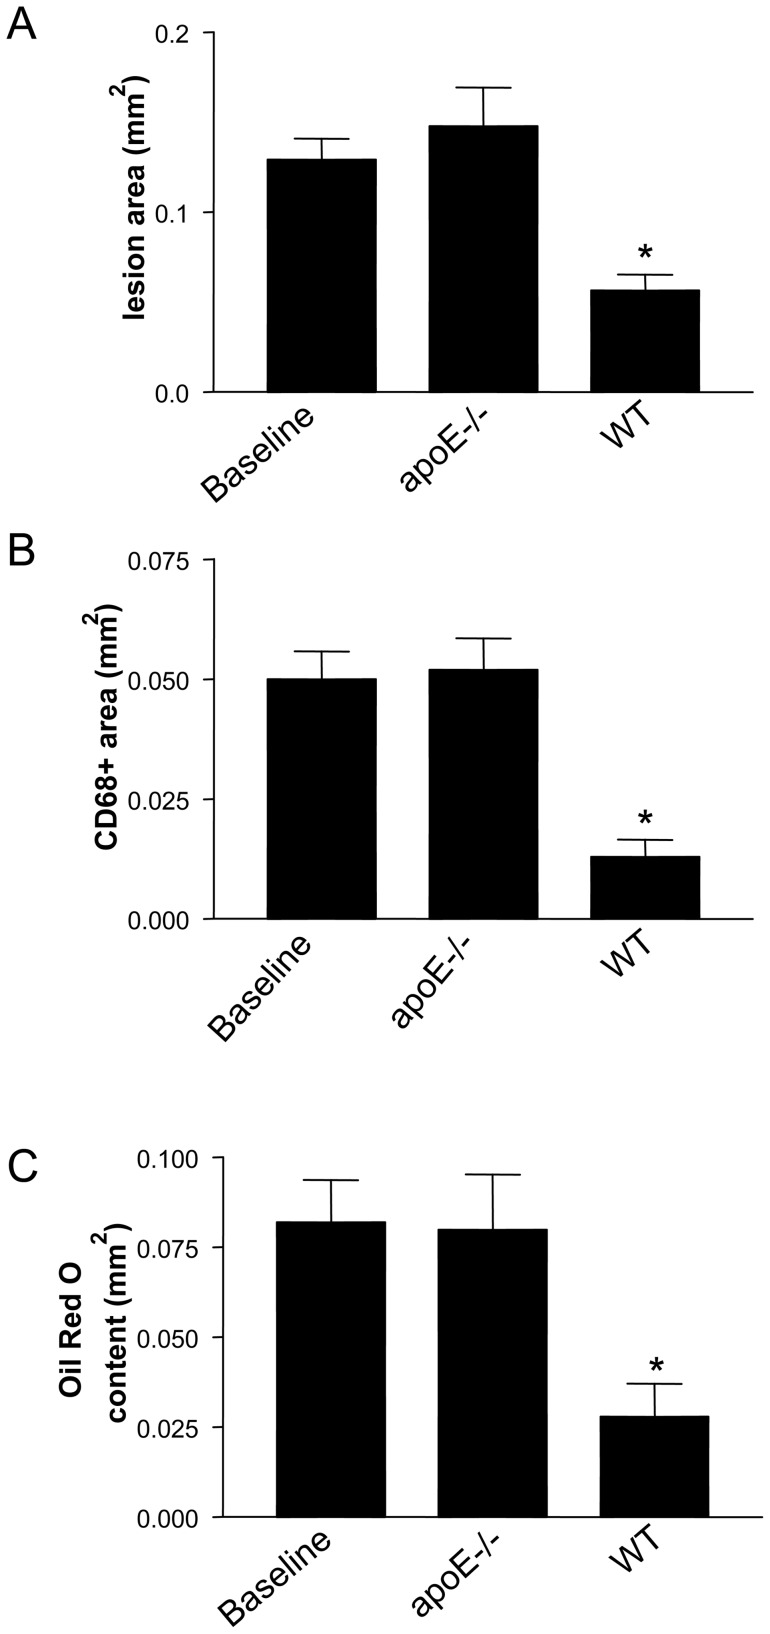
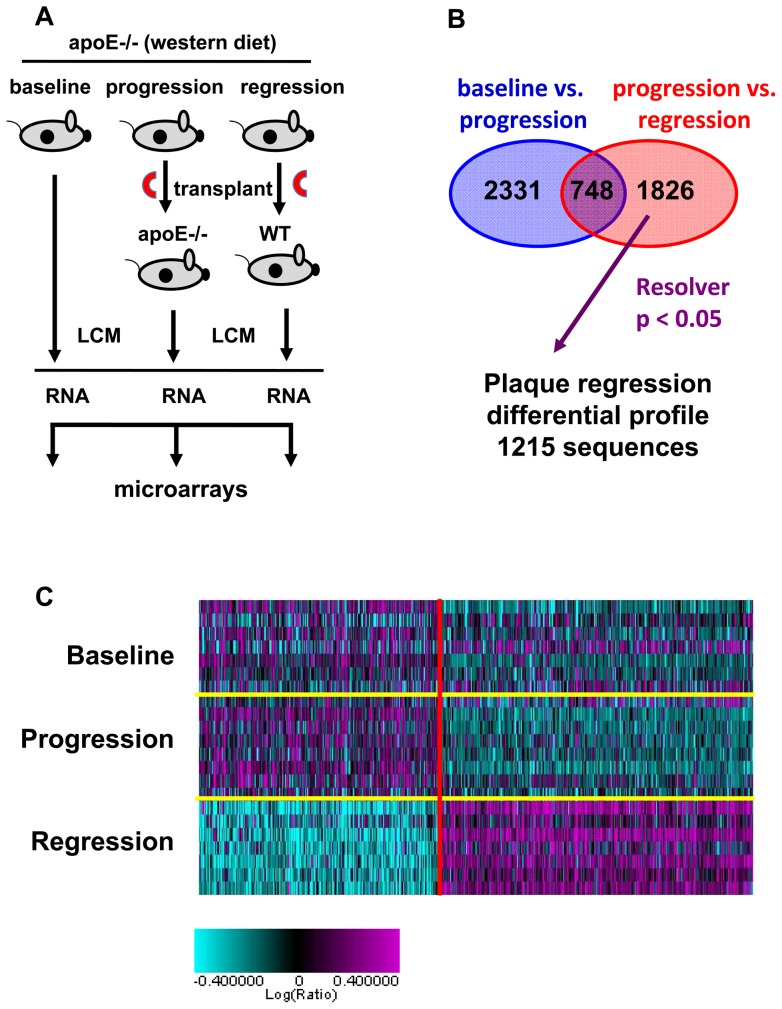
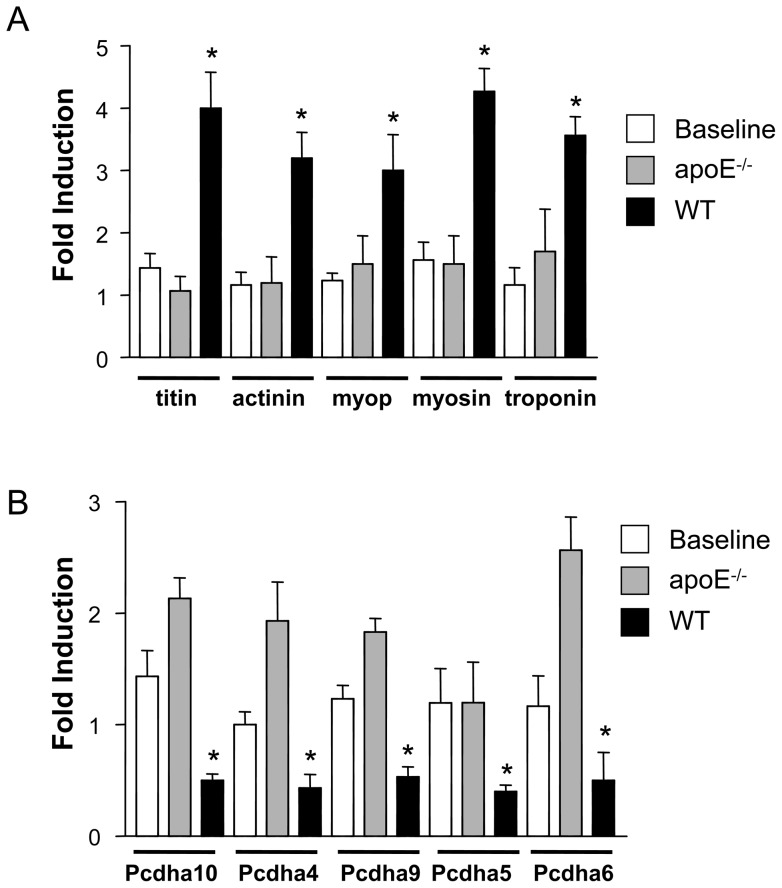
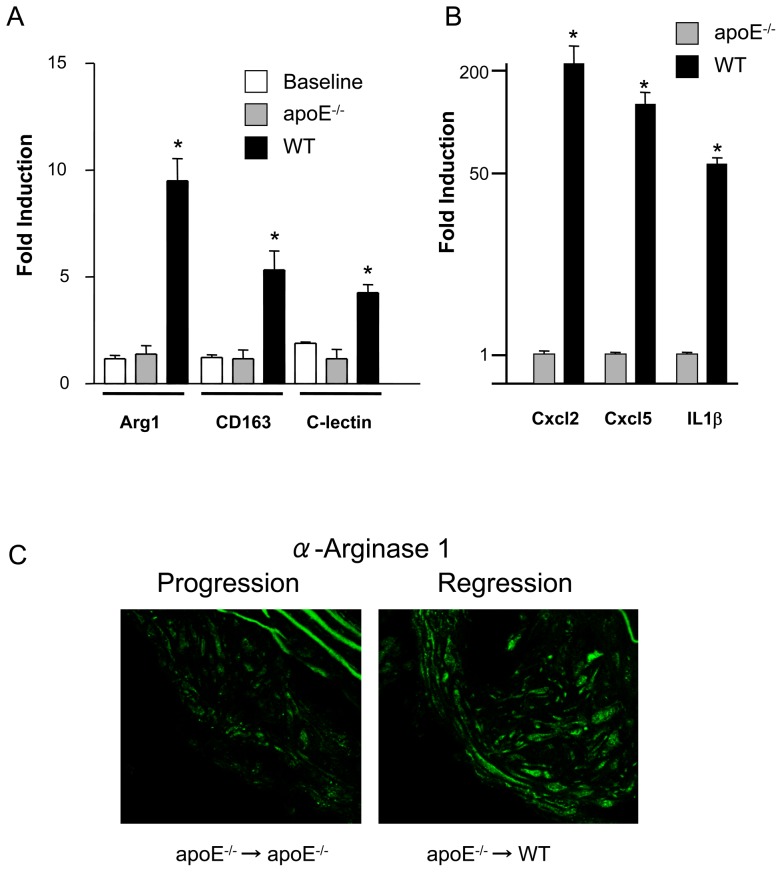
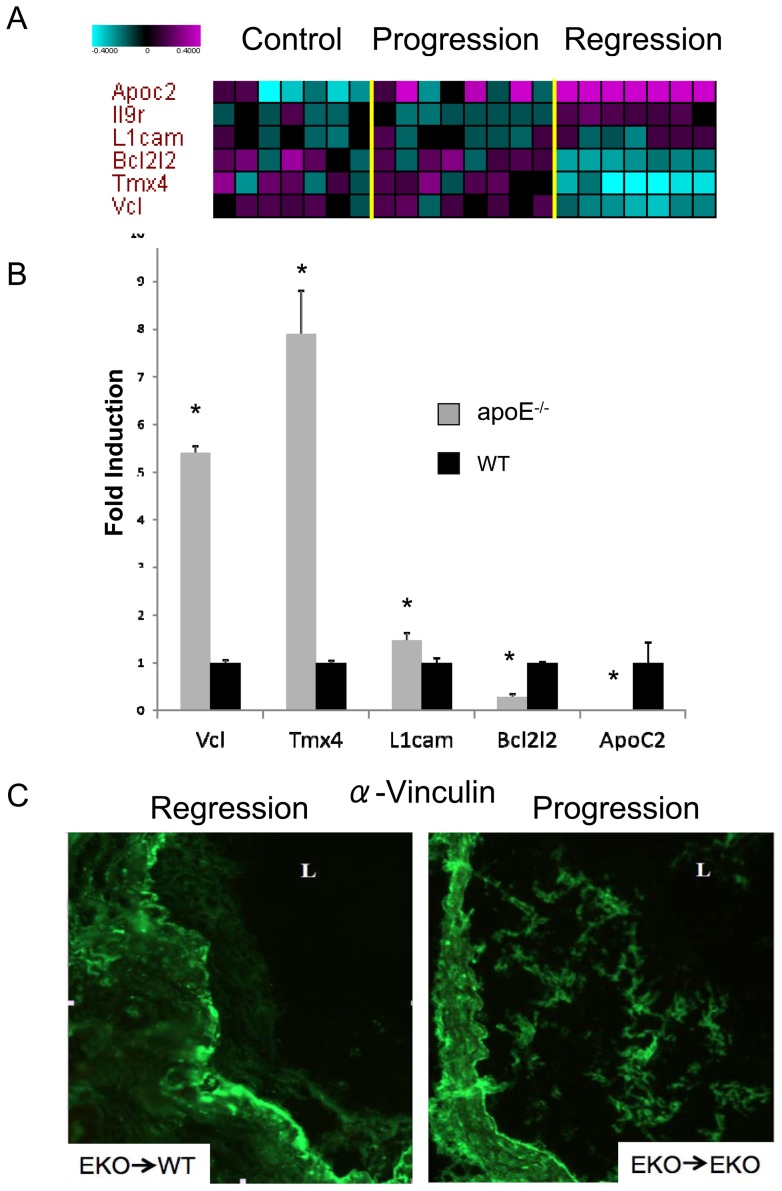
We have developed a mouse model of atherosclerotic plaque regression in which an atherosclerotic aortic arch from a hyperlipidemic donor is transplanted into a normolipidemic recipient, resulting in rapid elimination of cholesterol and monocyte-derived macrophage cells (CD68+) from transplanted vessel walls. To gain a comprehensive view of the differences in gene expression patterns in macrophages associated with regressing compared with progressing atherosclerotic plaque, we compared mRNA expression patterns in CD68+ macrophages extracted from plaque in aortic aches transplanted into normolipidemic or into hyperlipidemic recipients. In CD68+ cells from regressing plaque we observed that genes associated with the contractile apparatus responsible for cellular movement (e.g. actin and myosin) were up-regulated whereas genes related to cell adhesion (e.g. cadherins, vinculin) were down-regulated. In addition, CD68+ cells from regressing plaque were characterized by enhanced expression of genes associated with an anti-inflammatory M2 macrophage phenotype, including arginase I, CD163 and the C-lectin receptor. Our analysis suggests that in regressing plaque CD68+ cells preferentially express genes that reduce cellular adhesion, enhance cellular motility, and overall act to suppress inflammation.


Conflict of interest statement

Competing Interests: Vladimir Reiser and Oscar Puig worked for Merck at the time the research was carried out. Dr Garabedian has previously received research funds from Philip Morris USA, for research projects not related to the study reported in the manuscript. The remaining authors do not have any competing interests. This does not alter the authors' adherence to all the PLoS ONE policies on sharing data and materials.

Figures

Figure 1
Figure 1. Transfer of plaques to a normolipidemic plasma environment decreases their size and reduces their burden of CD68+ cells and cholesteryl esters.
Transplantation experiments were performed as described in Methods. Reversal of dyslipidemia (WT recipient) decreases plaque size (A) and CD68+ cell content (B) but continued dyslipidemia (apoE−/−) does not. Cholesteryl ester content was estimated by Oil Red O staining, which showed a decrease when the recipient was a WT mouse but not an apoE−/− mouse (C). The symbol * corresponds to statistical significance, p<0.05, when compared to donor apoE−/− mice (Baseline).
Figure 2
Figure 2. Identification of a plaque regression differential profile.
(A) Depiction of the procedure used to determine the plaque regression differential profile. Plaques from apoE−/− mice on a high fat diet were left intact (baseline) or the aortic arch (red semi circle) was transplanted into WT (regression) or apoE−/− (progression) mice. After 3 days, CD68+ cells were selected by Laser Capture Microdissection (LCM), RNA was prepared, amplified, labeled and hybridized to DNA microarray containing 23623 sequences. (B) Sequences affected by the transplantation procedure were defined as genes that were different in baseline (not transplanted) vs. progression (transplanted) groups (ANOVA P>0.1) and were removed from analysis. This left 1826 sequences that were differentially expressed between progression and regression groups (ANOVA P<0.05, in red). This set was further refined using Resolver error model (P>0.05), which eliminates unreliable variance estimation, and a 1.2 fold change filter, resulting in 1215 sequences that are referred to as the “plaque regression” differential profile. C) Heat map of genes differentially expressed in baseline, progression and regression. Individual aortic samples are on the Y-axis, individual genes are on the X-axis.
Figure 3
Figure 3. Regression is characterized by increasing expression of contractile proteins and down-regulation of cadherins.
CD68+ cells were selected from plaques by LCM, RNA was isolated and qPCR performed in order to validate microarray results. The results of qPCR showed that the contractile proteins were up-regulated (A), whereas members of the cadherin family were down-regulated (B). The symbol * corresponds to statistical significance, p<0.05, when mRNA level in the aortas from a transplanted group (apoE−/−, WT) was compared to mRNA in aortas from donor apoE−/− mice (Baseline). 9 mice were analyzed per group. Cyclophilin A was used for normalization in both cases.
Figure 4
Figure 4. Regression is characterized by macrophages expressing M2 markers.
(A) qPCR analysis for RNA encoding arginase I (Arg I), CD163 and C-lectin receptor was performed on RNA extracted from CD68+ cells removed from plaques that were not transplanted (baseline), plaques transplanted into apoE−/− recipients (progression environment) and plaques transplanted into wild type recipients (WT, regression environment). The symbol * corresponds to statistical significance, p<0.05, when signal in RNA from transplanted aortas (apoE−/−, WT) was compared to signal in RNA from aortas in donor apoE−/− mice (Baseline). 9 mice were analyzed per group. Cyclophilin A was used for normalization. (B), qPCR analysis for RNA encoding Cxcl2, Cxcl5 and IL1b. The symbol * corresponds to statistical significance, p<0.05, when signal in RNA from apoE−/− was compared to signal in RNA from WT mice. 9 mice were analyzed per group. GAPDH was used for normalization. (C) Arginase I staining shows increased protein levels in regression.
Figure 5
Figure 5. Multivariate causal pathway analysis for genes involved in regression.
(A) Heatmap displaying the relative levels of the 6 genes selected by HITON-PC algorithm for causal relationship to regression vs. progression/baseline task (Y-axis) in each of the 22 analyzed aortic samples (X-axis). B) RNA was isolated from laser captured CD68+ cells. qPCR was then performed in order to validate microarray results. The symbol * corresponds to statistical significance, p<0.05, when signal in RNA from aortas in regression (apoE −/−) was compared to signal in RNA from aortas in progression (WT). 9 mice were analyzed per group. GAPDH was used for normalization. C) Immunostaining for vinculin in a plaque derived from an aortic arch transplanted from an apoE−/− mouse into a wild type normolipidemic mouse (apoE−/− > WT) and from an apoE−/− mouse into a different apoE−/− mouse (apoE−/− > apoE−/−).

References

    1. Gaziano TA. Cardiovascular disease in the developing world and its cost-effective management. Circulation. 2005;112:3547–3553. - PubMed
    1. Grundy SM. Cholesterol and coronary heart disease. A new era. JAMA. 1986;256:2849–2858. - PubMed
    1. Grundy SM, Cleeman JI, Merz CN, Brewer HB, Jr, Clark LT, et al. Implications of recent clinical trials for the National Cholesterol Education Program Adult Treatment Panel III Guidelines. J Am Coll Cardiol. 2004;44:720–732. - PubMed
    1. Grundy SM, Cleeman JI, Merz CN, Brewer HB, Jr, Clark LT, et al. A summary of implications of recent clinical trials for the National Cholesterol Education Program Adult Treatment Panel III guidelines. Arterioscler Thromb Vasc Biol. 2004;24:1329–1330. - PubMed
    1. McMahan CA, McGill HC, Gidding SS, Malcom GT, Newman WP, et al. PDAY risk score predicts advanced coronary artery atherosclerosis in middle-aged persons as well as youth. Atherosclerosis. 2007;190:370–377. - PubMed

Publication types