Comparative Study
. 2012;7(6):e39812.
doi: 10.1371/journal.pone.0039812. Epub 2012 Jun 27.

Comparative lipidomics in clinical isolates of Candida albicans reveal crosstalk between mitochondria, cell wall integrity and azole resistance

Affiliations
Comparative Study

Comparative lipidomics in clinical isolates of Candida albicans reveal crosstalk between mitochondria, cell wall integrity and azole resistance

Ashutosh Singh et al. PLoS One. 2012.

Abstract

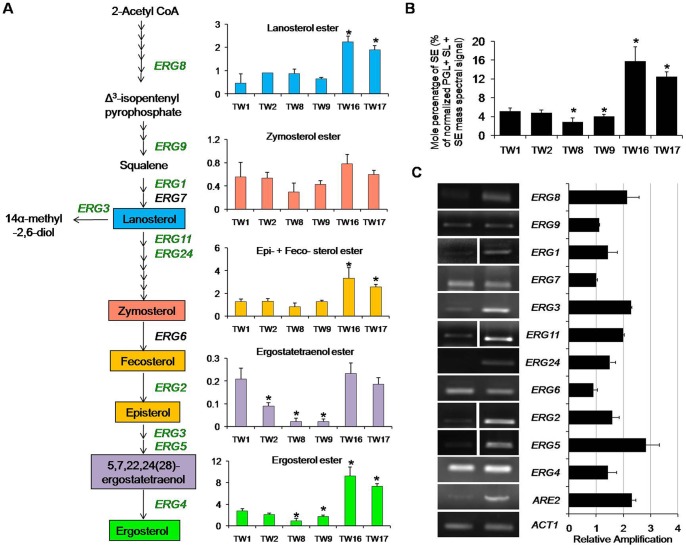
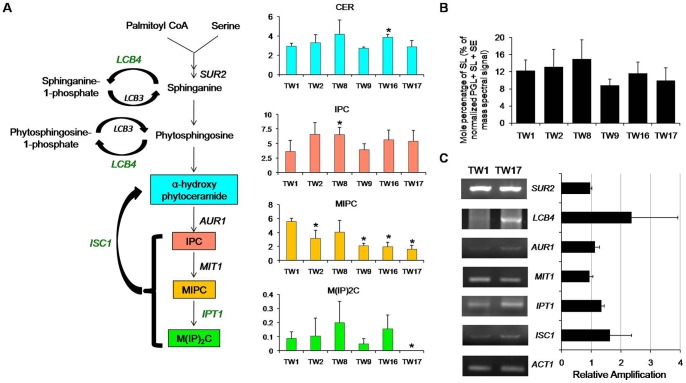
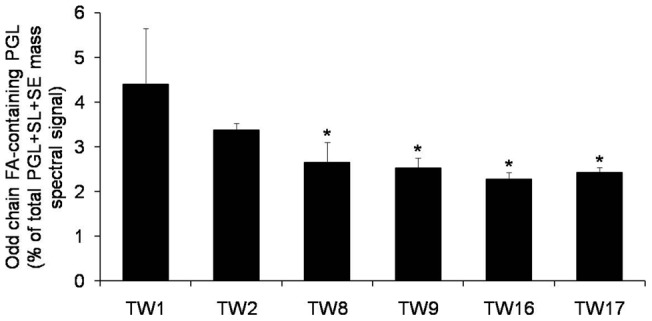
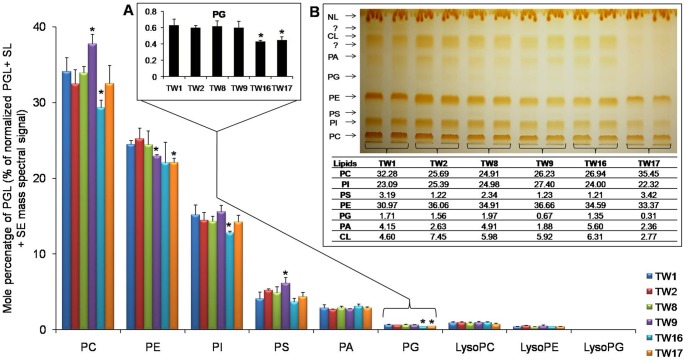
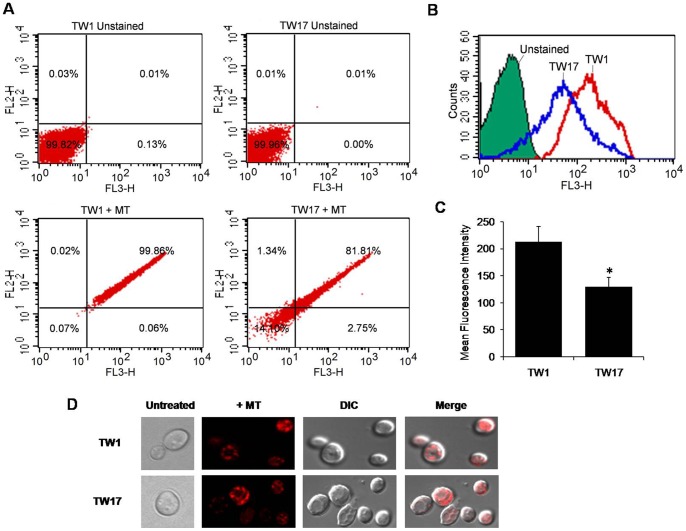
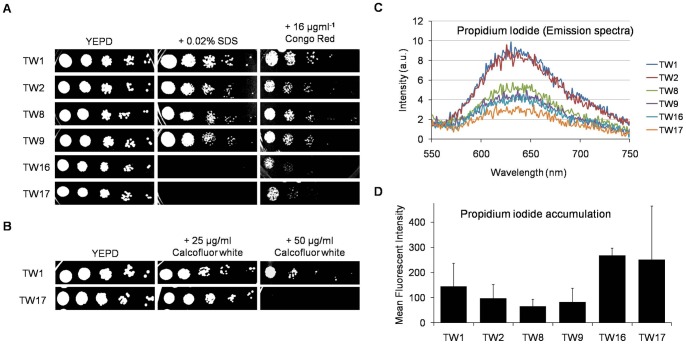
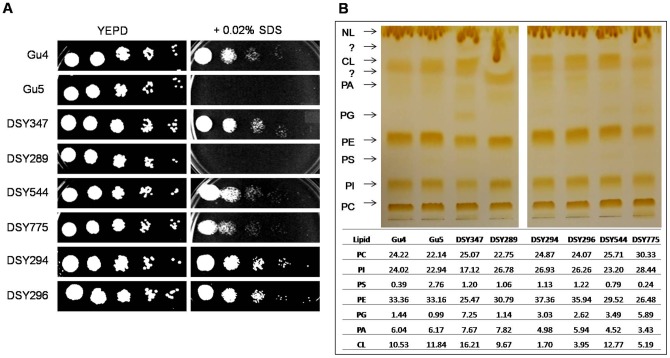
Prolonged usage of antifungal azoles which target enzymes involved in lipid biosynthesis invariably leads to the development of multi-drug resistance (MDR) in Candida albicans. We had earlier shown that membrane lipids and their fluidity are closely linked to the MDR phenomenon. In one of our recent studies involving comparative lipidomics between azole susceptible (AS) and azole resistant (AR) matched pair clinical isolates of C. albicans, we could not see consistent differences in the lipid profiles of AS and AR strains because they came from different patients and so in this study, we have used genetically related variant recovered from the same patient collected over a period of 2-years. During this time, the levels of fluconazole (FLC) resistance of the strain increased by over 200-fold. By comparing the lipid profiles of select isolates, we were able to observe gradual and statistically significant changes in several lipid classes, particularly in plasma membrane microdomain specific lipids such as mannosylinositolphosphorylceramides and ergosterol, and in a mitochondrial specific phosphoglyceride, phosphatidyl glycerol. Superimposed with these quantitative and qualitative changes in the lipid profiles, were simultaneous changes at the molecular lipid species levels which again coincided with the development of resistance to FLC. Reverse transcriptase-PCR of the key genes of the lipid metabolism validated lipidomic picture. Taken together, this study illustrates how the gradual corrective changes in Candida lipidome correspond to the development of FLC tolerance. Our study also shows a first instance of the mitochondrial membrane dysfunction and defective cell wall (CW) in clinical AR isolates of C. albicans, and provides evidence of a cross-talk between mitochondrial lipid homeostasis, CW integrity and azole tolerance.


Conflict of interest statement

Competing Interests: The authors have declared that no competing interests exist.

Figures

Figure 1
Figure 1. Upregulation of the sterol biosynthetic pathway in AR isolates.
(A) Changes in the composition of major sterols and its intermediates among the sequential isolates of C. albicans were analyzed as described in methods. Green and black colour of gene in the pathway (A) represents upregulation and no change, respectively. (B) Total SEs are represented as % of the total PGL+ SE + SL mass spectral signal after normalization to internal standards and were determined as described in methods. (C) The fold change in gene expression levels of various ERG genes (relative amplification to ACT1) between TW1 (most susceptible to FLC) and TW17 (most resistant to FLC) were determined by RT-PCR. The gel picture is a representative of the RT-PCR analysis performed in replicates. Values in the histogram are means ± SD (n = 3 for all Candida strains). Asterisks “*” represents p<0.05. Lipid data taken from Sheet S1, worksheet 3 and 4.
Figure 2
Figure 2. Downregulation of the SL biosynthetic pathway in AR isolates.
(A) Changes in the composition of major SL classes among the sequential isolates of C. albicans were assessed as described in methods. Green and black colour of gene in the pathway represents upregulation and no change, respectively. (B) Total SLs are represented as % of the total PGL + SE + SL mass spectral signal after normalization to internal standards and were determined as described in methods. (C) The fold change in expression levels of various SL biosynthetic pathway genes (relative amplification to ACT1) between TW1 (most susceptible to FLC) and TW17 (most resistant to FLC) were determined by RT-PCR. The gel picture is a representative of the RT-PCR analysis performed in replicates. Values in the histogram are means ± SD (n = 3 for all Candida strains). Asterisks “*” represents p<0.05. Lipid data taken from Sheet S1, worksheet 4.
Figure 3
Figure 3. Accumulation of odd chain-FA containing PGLs in the FLC resistant isolates.
Total amount of odd chain FA-containing PGL was calculated by adding the normalized amounts of each odd chain FA containing PGL molecular species (namely 31-C, 33-C, 35-C and 37-C containing PGLs). The data is represented as % of total PGL + SL + SE mass spectral signal after normalization to internal standards. Values are mean of 3 independent analyses (n = 3). Asterisks “*” represents p < 0.05. Lipid data taken from Sheet S1 (worksheet 3), Table S1 and Table S3.
Figure 4
Figure 4. The sequential isolates of C. albicans shows modulation of PGL metabolism in the AR isolates.
Changes in the composition of major SL classes among the sequential isolates of C. albicans were assessed as described in methods. Data is represented as % of the total PGL+ SE + SL mass spectral signal after normalization to internal standards. Inset A depicts in larger scale, the change in PG levels among the sequential isolates of C. albicans. Values are mean of 3 independent analyses (n = 3). Data taken from Sheet S1, worksheet 4. Inset B shows PL analysis of strains by HP-TLC: cells were grown overnight (to the exponential growth phase) in YEPD medium. Lipids were extracted as described earlier and separated by thin-layer chromatography using chloroform: methanol: acetic acid (65:28:8) as the solvent system. The mobility of CL, PA, PG, PE, PS, PI and PC are indicated after iodine staining (n = 2). The corresponding values of each lipid class as mol % are also indicated.
Figure 5
Figure 5. Measurement of mitochondrial membrane dysfunction among TW1 and TW17 isolates.
For the flow cytometry analysis, cells were stained with 100 nM MitoTracker Red CMXRos (which fluoresces upon oxidation in respiring mitochondria). (A) Quadrant plots, (B) histograms and (C) bar graph of flow cytometry analysis between TW1 and TW17 are depicted (n = 4). (D) The red fluorescence of MitoTracker Red CMXRos was also visualized by confocal microscopy.
Figure 6
Figure 6. FLC exposure alters CW integrity in the sequential isolates of C. albicans.
(A) Sequential isolates were tested with CW perturbing agents like Triton X-100 (upto 0.04%), 0.02% SDS, 16 µgml−1 Congo Red. (B) Susceptibility to Calcofluor White (upto 50 µgml−1) was tested. These spot tests were performed as described in methods. (C) Passive diffusion rate of PI was monitored by spectrofluorimeter. Briefly, the cells were pre-incubated with 3 µM PI for 45 min and then centrifuged. The supernatant was taken and the emission spectrum of PI was recorded for each strain. (D) The cells with PI were subjected to flow cytometry analysis to measure the amount of PI accumulated in each strain. The data is represented as the mean fluorescent intensity (n = 2).
Figure 7
Figure 7. FLC exposure leads to gradual development of a partially compromised CW and affects PG biosynthesis in several other clinical isolates of C. albicans.
A. Several pairs of isogenic clinical isolates of C. albicans were tested with 0.02% SDS, a CW perturbing agent. The spot tests were performed as described in methods. B. PL analysis of various AS/AR clinically matched isogenic isolates by HP-TLC. Briefly, cells were grown overnight (to the exponential growth phase) in YEPD medium. Lipids were extracted as described earlier and separated by thin-layer chromatography using chloroform: methanol: acetic acid (65:28:8) as the solvent system. HP-TLC analysis of each match pair and the corresponding values of each lipid class as mol % are also indicated.

Similar articles

Cited by

References

    1. Richardson MD. Changing patterns and trends in systemic fungal infections. J Antimicrob Chemother. 2005;56:i5–i11. - PubMed
    1. Pfaller MA, Diekema DJ. Epidemiology of Invasive Candidiasis: a Persistent Public Health Problem. Clin Microbiol Rev. 2007;20:133–163. - PMC - PubMed
    1. Clark TA, Hajjeh RA. Recent trends in the epidemiology of invasive mycoses. Curr Opin Infect Dis. 2002;15:569–574. - PubMed
    1. Tortorano AM, Kibbler C, Peman J, Bernhardt H, Klingspor L, et al. Candidaemia in Europe: epidemiology and resistance. Int J Antimicrob Agents. 2006;27:359–366. - PubMed
    1. Prasad R, Kapoor K. Multidrug resistance in yeast Candida. Int Rev Cytol. 2005;242:215–248. - PubMed

Publication types

MeSH terms