. 2012;7(6):e39959.
doi: 10.1371/journal.pone.0039959. Epub 2012 Jun 27.

The increased activity of TRPV4 channel in the astrocytes of the adult rat hippocampus after cerebral hypoxia/ischemia

Affiliations

The increased activity of TRPV4 channel in the astrocytes of the adult rat hippocampus after cerebral hypoxia/ischemia

Olena Butenko et al. PLoS One. 2012.

Abstract

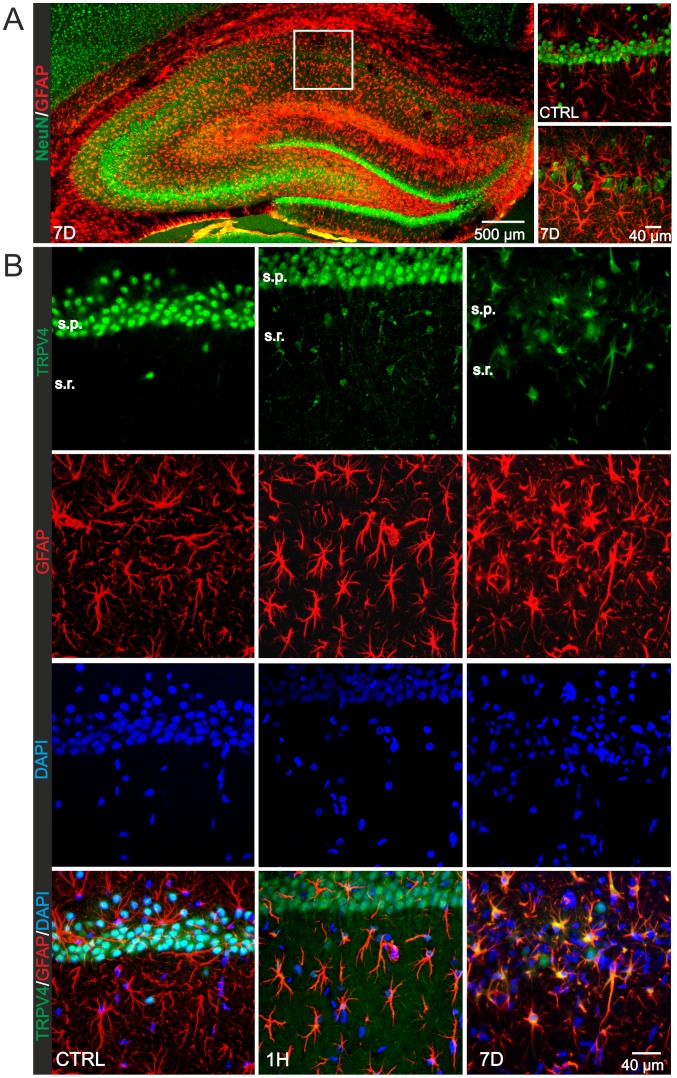
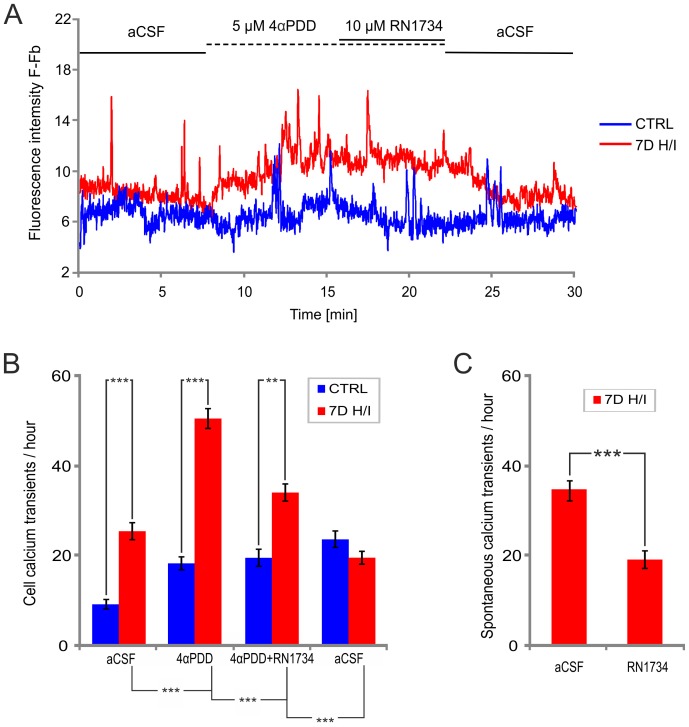
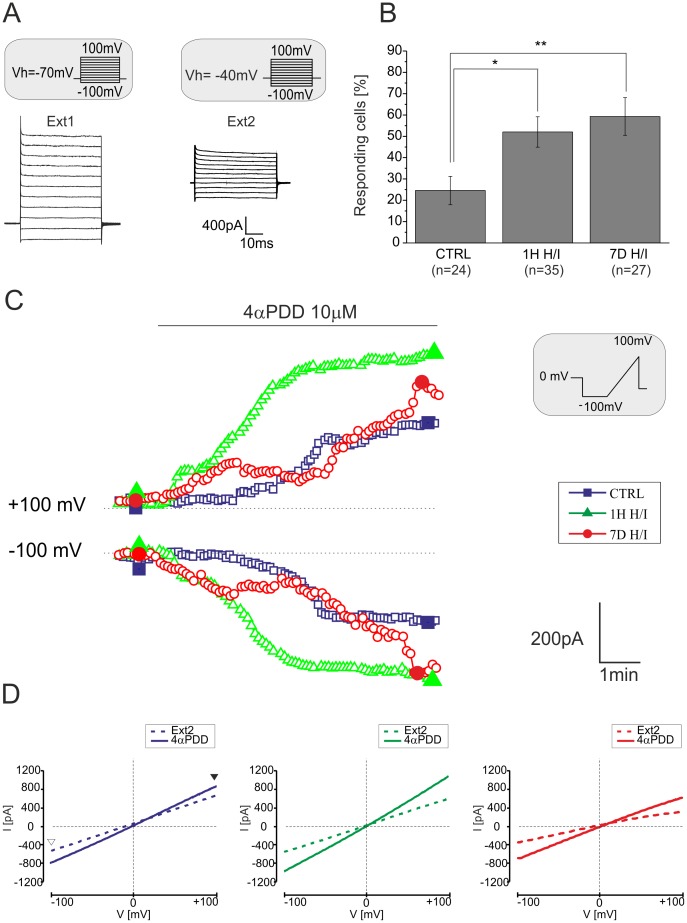
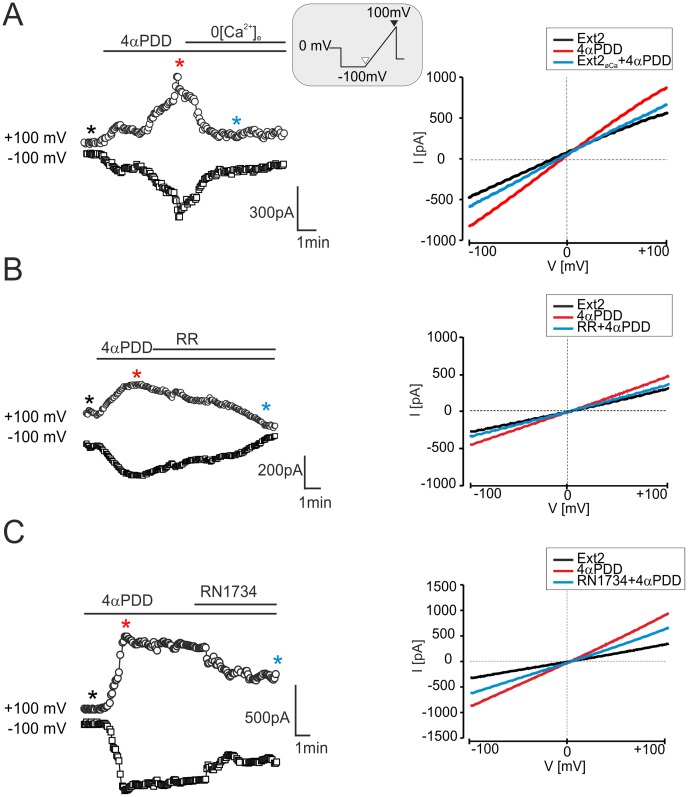
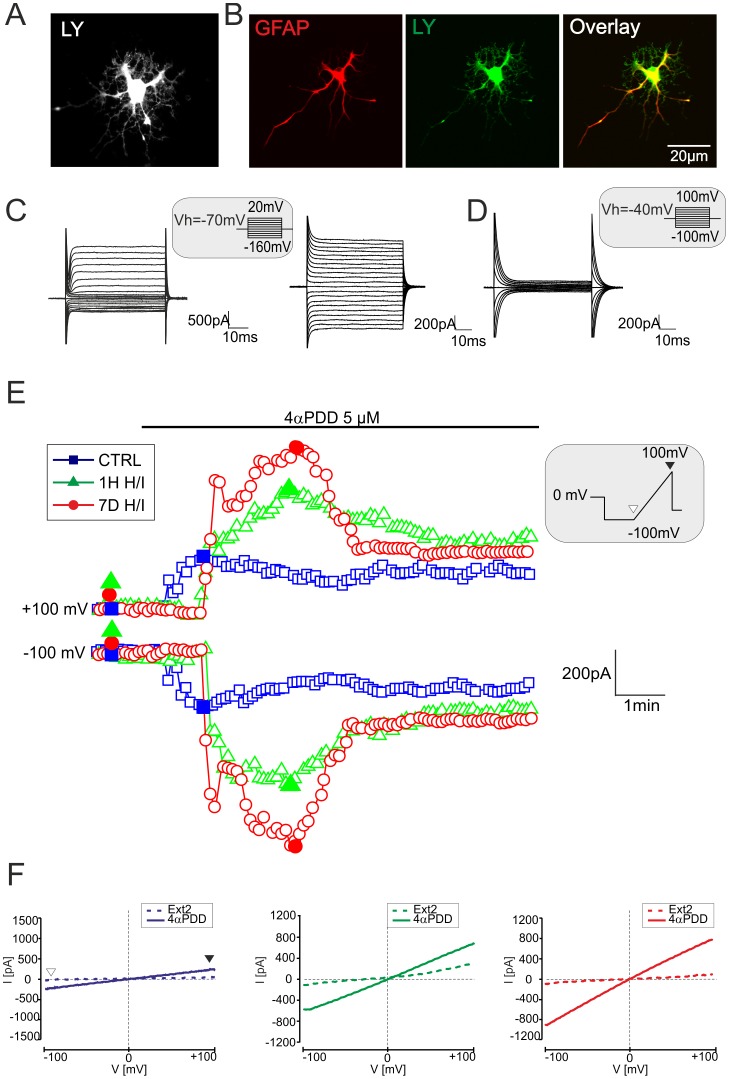
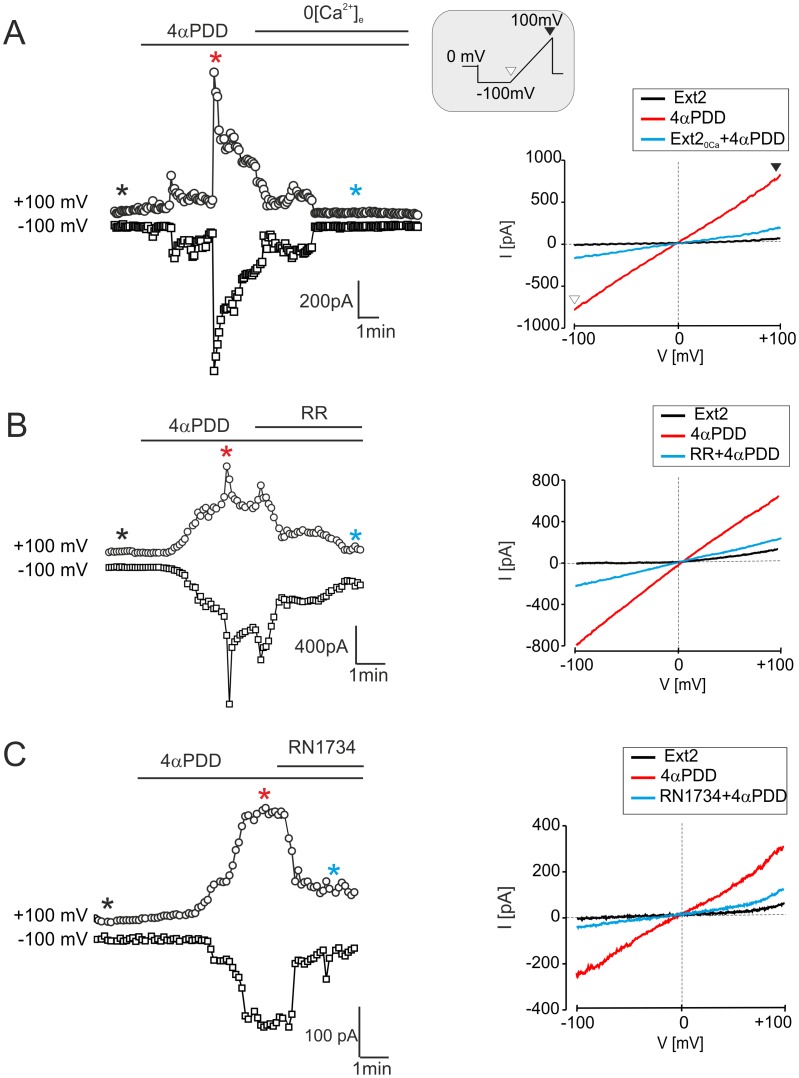
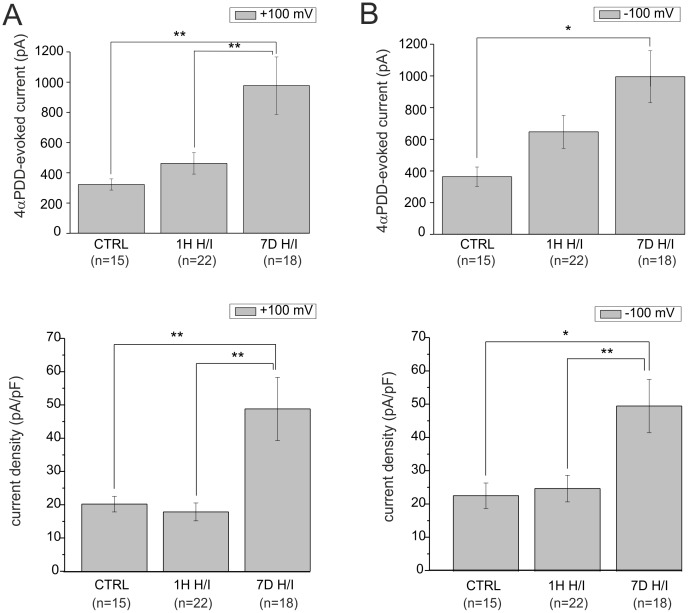
The polymodal transient receptor potential vanilloid 4 (TRPV4) channel, a member of the TRP channel family, is a calcium-permeable cationic channel that is gated by various stimuli such as cell swelling, low pH and high temperature. Therefore, TRPV4-mediated calcium entry may be involved in neuronal and glia pathophysiology associated with various disorders of the central nervous system, such as ischemia. The TRPV4 channel has been recently found in adult rat cortical and hippocampal astrocytes; however, its role in astrocyte pathophysiology is still not defined. In the present study, we examined the impact of cerebral hypoxia/ischemia (H/I) on the functional expression of astrocytic TRPV4 channels in the adult rat hippocampal CA1 region employing immunohistochemical analyses, the patch-clamp technique and microfluorimetric intracellular calcium imaging on astrocytes in slices as well as on those isolated from sham-operated or ischemic hippocampi. Hypoxia/ischemia was induced by a bilateral 15-minute occlusion of the common carotids combined with hypoxic conditions. Our immunohistochemical analyses revealed that 7 days after H/I, the expression of TRPV4 is markedly enhanced in hippocampal astrocytes of the CA1 region and that the increasing TRPV4 expression coincides with the development of astrogliosis. Additionally, adult hippocampal astrocytes in slices or cultured hippocampal astrocytes respond to the TRPV4 activator 4-alpha-phorbol-12,-13-didecanoate (4αPDD) by an increase in intracellular calcium and the activation of a cationic current, both of which are abolished by the removal of extracellular calcium or exposure to TRP antagonists, such as Ruthenium Red or RN1734. Following hypoxic/ischemic injury, the responses of astrocytes to 4αPDD are significantly augmented. Collectively, we show that TRPV4 channels are involved in ischemia-induced calcium entry in reactive astrocytes and thus, might participate in the pathogenic mechanisms of astroglial reactivity following ischemic insult.


Conflict of interest statement

Competing Interests: The authors have declared that no competing interests exist.

Figures

Figure 1
Figure 1. Immunohistochemical analyses of the rat hippocampus after hypoxia/ischemia followed by reperfusion.
(A) Coronal sections of the rat hippocampus immunostained for a neuronal marker (NeuN) and the astrocytic marker glial fibrillary acidic protein (GFAP) in sham-operated rats (CTRL) and those 7 days (7D) after hypoxia/ischemia (H/I). Enlargements of the tissue section shown on the right demonstrate pyramidal cell loss and the formation of reactive gliosis in the hippocampal CA1 region 7D after H/I when compared to controls. (B) TRPV4 immunostaining in the CA1 region of the hippocampus. Coronal slices from controls and ischemic rats were labeled for TRPV4 (green) and GFAP (red). Note that in controls the TRPV4 immunoreactivity was detected in pyramidal cells and more rarely in astrocytes. With developing astrogliosis TRPV4 immunoreactivity was increased in astrocytes. Seven days after H/I no TRPV4 expression was detected in pyramidal cells, whereas it was markedly increased in astrocytes. The following abbreviations are used: H/I (hypoxia/ischemia), CTRL (sham-operated rats), 1H (1 hour), 7D (7 days) after hypoxia/ischemia, s.p. (stratum pyramidale), s.r. (stratum radiatum).
Figure 2
Figure 2. Western blot and PCR analyses of TRPV4 protein in the CA1 region of the hippocampus after hypoxia/ischemia.
(A) Time-dependent changes in the expression of TRPV4, GFAP and β-actin proteins in the CA1 region of the hippocampus of sham-operated rats (CTRL), 1 hour (1H), 6 hours (6H), 1 day (1D), 3 days (3D) and 7 days (7D) after hypoxia/ischemia. Note that the expression of GFAP gradually increased 3 and 7 days after ischemia. β-actin was used as a loading control. (B) Time-dependent changes in TRPV4 protein levels showing the significant increase in TRPV4 protein 1H after H/I. Data were obtained from 3 independent Western blot analyses. (C) Quantitative RT-PCR revealing significantly increased TRPV4 mRNA levels 1H after H/I compared to sham-operated rats. Data were obtained from 3 independent isolations of total mRNA from the hippocampal CA1 region. Statistical significance was calculated using one-way ANOVA and Dunnett’s multiple comparison test; *p<0.05 significant, **p<0.01 very significant.
Figure 3
Figure 3. The TRPV4 agonist 4αPDD triggers Ca2+ oscillations in astrocytes of the hippocampal CA1 region.
(A–D) Astrocytes in acute rat hippocampal slices loaded with the calcium fluorescent probe Fluo-4 AM respond with an increase in fluorescence to the application of the TRPV4 channel agonist 4αPDD (5 µM). (A) Cells before 4αPDD application in aCSF, (B) during 4αPDD application, (C) during 4αPDD application in aCSF without Ca2+ (aCSFØCa) and (D) during washout with aCSF. Note the increased fluorescence indicated by the arrow in B. (E) Cells loaded with Sulforhodamine 101 (SR-101) to verify that the measured cells are astrocytes. (F) Representative fluorescence traces with background correction of astrocytes in acute slices prepared from sham-operated rats (CTRL) and rats 1 hour (1H H/I) and 7 days (7D H/I) after hypoxia/ischemia. (G) Histogram of the mean intracellular calcium transients per hour before 4αPDD application (aCSF), during 4αPDD application (4αPDD), during 4αPDD application in aCSFØCa (4αPDD in aCSFØCa) and following washout (aCSF), measured in astrocytes from acute hippocampal slices prepared from the brains of sham-operated rats (CRTL) and those 1 hour (1H H/I) and 7 days (7D H/I) after hypoxia/ischemia. (H) Histogram of the number of responding cells (n =  number of all analyzed cells). The values are presented as mean ± S.E.M. Statistical significance was calculated using one-way ANOVA. *p<0.05, significant; ***p<0.001, extremely significant.
Figure 4
Figure 4. The TRPV4 antagonist RN1734 decreases 4αPDD-induced and spontaneous Ca2+ oscillations in astrocytes of the hippocampal CA1 region 7 days after ischemia.
(A) Representative fluorescence traces of hippocampal astrocytes in slices prepared from sham-operated rats (CTRL) and rats 7 days after hypoxia/ischemia (7D H/I) before 4αPDD application (aCSF), during 5 µM 4αPDD application, during the application of 5 µM 4αPDD with 10 µM RN1734 and following washout (aCSF). (B) Histogram of the mean intracellular calcium transients per hour before 4αPDD application (aCSF), during the application of 5 µM 4αPDD, during the application of 5 µM 4αPDD +10 µM RN1734 and following washout in aCSF, in astrocytes in hippocampal slices prepared from the brains of sham-operated rats (CRTL, n = 43) and those 7 days after hypoxia/ischemia (7D H/I, n = 40). (C) Histogram of the mean spontaneous intracellular calcium transients per hour before RN1734 application (aCSF) and during the application of 10 µM RN1734 (RN1734), measured in astrocytes from acute hippocampal slices 7 days after hypoxia/ischemia (7D H/I, n = 10). The values are presented as mean ± S.E.M. Statistical significance was calculated using one-way ANOVA in (B) and a paired t-test in (C); ***p<0.001 extremely significant, **p<0.01 very significant.
Figure 5
Figure 5. 4αPDD-evokes an increase in membrane conductance in astrocytes in situ.
(A) Typical current pattern of astrocytes in situ recorded in the CA1 region of the hippocampus 7 days after H/I at a holding potential of −70 mV (left, the extracellular solution Ext1 contained K+ and Na+) and at −40mV (right, K+ and Na+ were replaced by Cs+ in the extracellular solution Ext2). (B) Percentage of hippocampal astrocytes from sham-operated rats (CTRL), and rats 1H and 7D after H/I that responded to 10 µM 4αPDD (n =  number of cells). The threshold for a 4αPDD current response was 120% of the control ramp current (prior to agonist application), at a voltage of +/−100 mV. The values are presented as mean ± S.E.M. Statistical significance was calculated using one-way ANOVA. *p<0.05, significant; **p<0.01, very significant. (C) Time course of 4αPDD-evoked currents measured from the ramp protocol in astrocytes of controls (blue squares) and astrocytes 1H (green triangles) and 7D after H/I (red circles). Currents were measured at −100 mV (white arrowhead) and +100 mV (black arrowhead) in response to a voltage ramp stimulation protocol (see the inset). (D) Representative traces of steady state currents (same cells as in C) recorded before (in Ext2 solution, dashed line) and during 4αPDD application (full line) in hippocampal astrocytes of controls (left) and those 1H (middle) and 7D after H/I (right). Representative traces of steady state currents were obtained at the times indicated by the filled blue squares, green triangles and red circles in C. White and black arrowheads indicate the applied voltage ramp and the corresponding current traces (see the inset in C).
Figure 6
Figure 6. Currents evoked by 4αPDD in hippocampal astrocytes in situ are reduced by calcium-free extracellular solution, Ruthenium Red or RN1734.
(A–C, left) Time course of 4αPDD-evoked currents measured from the ramp protocol in astrocytes 7D after H/I (for the voltage protocol see the inset) prior to and during 4αPDD (10 µM) application and after removing extracellular Ca2+ (Ext2ØCa, A) or after the application of TRPV4 inhibitors, such as Ruthenium Red (RR, 10 µM, B) or RN1734 (10 µM, C). (A-C, right) The traces of the steady state currents (same cells as in left) obtained in Ext2 solution (black lines), during 4αPDD application (red lines) and after removing extracellular Ca2+ (Ext2ØCa, A) or after the application of TRPV4 inhibitors, such as Ruthenium Red (RR, 10 µM, B) or RN1734 (10 µM, C), are indicated by blue lines. Representative traces of steady state currents were obtained at the times indicated by asterisks of the corresponding colors.
Figure 7
Figure 7. Immunocytochemical identification of cultured astrocytes dissociated from the CA1 region of the hippocampus.
(A) The distinct morphology of astrocytes isolated from sham-operated rats or from the ischemic hippocampal CA1 region: flat astrocytes (top) and non-flat astrocytes (bottom) cultured for 4–5 days. Both types of astroglial cells expressed GFAP and GLAST and were also positive for TRPV4. (B) The incidence of flat and non-flat astrocytes in controls (CTRL) and those isolated from the CA1 hippocampal region 1H and 7D after H/I (n =  number of coverslips). The values are presented as mean ± S.E.M. Statistical significance was calculated using one-way ANOVA. *p<0.05, significant; ***p<0.001, extremely significant.
Figure 8
Figure 8. Intracellular Ca2+ measurements in cultured astrocytes dissociated from the hippocampal CA1 region.
(A–D) Typical fluorescence response elicited by 5 µM 4αPDD in cultured hippocampal astrocytes. (A) Two astrocytes in aCSF before 4αPDD application, (B) during 4αPDD application in aCSF, (C) during 4αPDD application in aCSFØCa and (D) during washout with aCSF. (E) Immunocytochemical staining for glial fibrillary acidic protein (GFAP) to verify astrocyte identity. (F) Representative fluorescence traces of cultured astrocytes isolated from sham-operated animals (CTRL) and animals 1 hour (1H H/I) and 7 days (7D H/I) after H/I in response to stimulation as in A–D. Note the delay between the 4αPDD challenge and the onset of the fluorescence increase under the 3 conditions. (G) Histogram of the variation in the fluorescence intensities dF/F0 depicting the maximum intensity upon 4αPDD application in aCSF (4αPDD), the average intensity during the last minute of 4αPDD application in aCSFØCa (4αPDD in aCSFØCa) and the maximum intensity during washout (aCSF). (H) Histogram of the number of responding cells (top) and histogram of the 4αPDD response time delay (bottom). Note that in astrocytes 7 days (7D) after H/I, TRPV4-mediated Ca2+ entry is enhanced and the number of responding cells is higher when compared to control. The values are presented as mean ± S.E.M. Statistical significance was calculated using one-way ANOVA. *p<0.05, significant; **p<0.01, very significant; ***p<0.001, extremely significant.
Figure 9
Figure 9. 4αPDD-induced currents in cultured astrocytes dissociated from the hippocampal CA1 region.
(A) An image of a Lucifer Yellow (LY)-loaded astrocyte taken by a digital camera immediately after patch-clamp recording and (B) the same astrocyte identified by immunostaining with glial fibrillary acidic protein (GFAP). The overlay image shows the co-localization of GFAP with LY. (C) “Complex” and “passive” current patterns in astrocytes in vitro evoked by membrane depolarization and hyperpolarization from the holding potential of −70 mV. The currents were recorded using K+- and Na+-containing intra- and extracellular solutions (Int1 and Ext1). The voltage step protocol is shown in the inset. (D) Current pattern evoked with a voltage step protocol (see the inset) in cultured astrocytes recorded in intra- and extracellular solutions in which K+ and Na+ were replaced by Cs+ (Int2 and Ext2). Note the marked reduction in membrane conductance. (E) Time course of 4αPDD-evoked currents measured from the ramp protocol in astrocytes of controls (blue squares) and astrocytes 1H (green triangles) and 7D after H/I (red circles). Currents were measured at −100 mV (white arrowhead) and +100 mV (black arrowhead) in response to a voltage ramp stimulation protocol (see the inset). (F) Representative traces of steady state currents (same cells as in E) recorded prior to (in Ext2 solution, dashed line) and during 4αPDD application (full line) in cultured astrocytes of controls (left) and those 1H (middle) and 7D after H/I (right). Representative traces of steady state currents were obtained at the times indicated by the filled blue squares, green triangles and red circles in E. White and black arrowheads indicate the applied voltage ramp and the corresponding current traces (see the inset in E).
Figure 10
Figure 10. Currents evoked by 4αPDD in astrocytes in vitro are reduced by calcium-free extracellular solution, Ruthenium Red or RN1734.
(A–C, left) Time course of 4αPDD-evoked currents measured from the ramp protocol in astrocytes isolated from the hippocampus 7D after H/I (for the voltage protocol see the inset) prior to and during 4αPDD (5 µM) application and after removing extracellular Ca2+ (Ext2ØCa, A) or after the application of TRPV4 inhibitors, such as Ruthenium Red (RR, 10 µM, B) or RN1734 (10 µM, C). (A–C, right) The traces of steady state currents (same cells as in left) obtained in Ext2 solution (black lines), during 4αPDD application (red lines) and after removing extracellular Ca2+ (Ext2ØCa, A) or after the application of TRPV4 inhibitors, such as Ruthenium Red (RR, 10 µM, B) or RN1734 (10 µM, C), are indicated by blue lines. Representative traces of steady state currents were obtained at the times indicated by asterisks of the corresponding colors.
Figure 11
Figure 11. Changes in TRPV4-mediated currents in response to hypoxia/ischemia.
Histograms of 4αPDD-evoked changes in current amplitudes (A top) and current densities (A bottom) at +100 mV and current amplitudes (B top) and current densities (B bottom) at −100 mV in control astrocytes (CTRL), and those isolated from rats 1H and 7D after H/I. The values are presented as mean ± S.E.M. Statistical significance was calculated using one-way ANOVA. *p<0.05, significant; **p<0.01, very significant.

Similar articles

Cited by

References

    1. Chvatal A, Anderova M, Neprasova H, Prajerova I, Benesova J, et al. Pathological potential of astroglia. Physiol Res. 2008;57:S101–110. - PubMed
    1. Verkhratsky A, Anderova M, Chvatal A. Differential calcium signalling in neuronal-glial networks. Front Biosci. 2009;14:2004–2016. - PubMed
    1. Nedergaard M, Rodriguez JJ, Verkhratsky A. Glial calcium and diseases of the nervous system. Cell Calcium. 2010;47:140–149. - PubMed
    1. Latour I, Hamid J, Beedle AM, Zamponi GW, Macvicar BA. Expression of voltage-gated Ca2+ channel subtypes in cultured astrocytes. Glia. 2003;41:347–353. - PubMed
    1. Lalo U, Pankratov Y, Kirchhoff F, North RA, Verkhratsky A. NMDA receptors mediate neuron-to-glia signaling in mouse cortical astrocytes. J Neurosci. 2006;26:2673–2683. - PMC - PubMed

Publication types