

Recovering from a bad start: rapid adaptation and tradeoffs to growth below a threshold density
- PMID: 22762241
- PMCID: PMC3495640
- DOI: 10.1186/1471-2148-12-109
Recovering from a bad start: rapid adaptation and tradeoffs to growth below a threshold density
Abstract
Background: Bacterial growth in well-mixed culture is often assumed to be an autonomous process only depending upon the external conditions under control of the investigator. However, increasingly there is awareness that interactions between cells in culture can lead to surprising phenomena such as density-dependence in the initiation of growth.
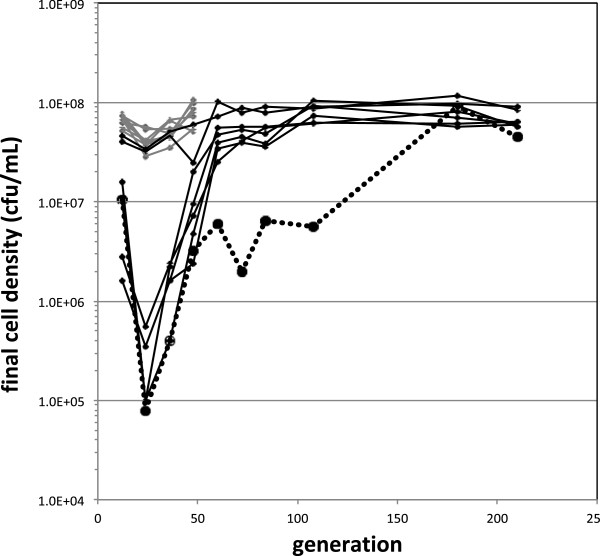
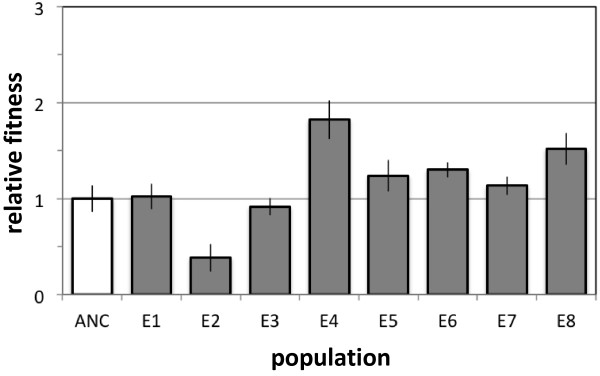
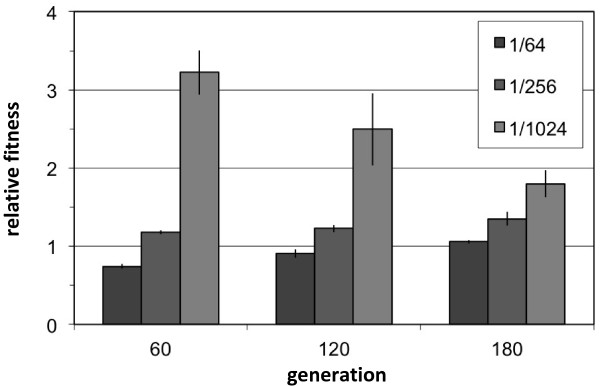
Results: Here I report the unexpected discovery of a density threshold for growth of a strain of Methylobacterium extorquens AM1 used to inoculate eight replicate populations that were evolved in methanol. Six of these populations failed to grow to the expected full density during the first couple transfers. Remarkably, the final cell number of six populations crashed to levels 60- to 400-fold smaller than their cohorts. Five of these populations recovered to full density soon after, but one population remained an order of magnitude smaller for over one hundred generations. These variable dynamics appeared to be due to a density threshold for growth that was specific to both this particular ancestral strain and to growth on methanol. When tested at full density, this population had become less fit than its ancestor. Simply increasing the initial dilution 16-fold reversed this result, revealing that this population had more than a 3-fold advantage when tested at this lower density. As this population evolved and ultimately recovered to the same final density range as the other populations this low-density advantage waned.
Conclusions: These results demonstrate surprisingly strong tradeoffs during adaptation to growth at low absolute densities that manifest over just a 16-fold change in density. Capturing laboratory examples of transitions to and from growth at low density may help us understand the physiological and evolutionary forces that have led to the unusual properties of natural bacteria that have specialized to low-density environments such as the open ocean.
Figures
Similar articles
-
Evolution after introduction of a novel metabolic pathway consistently leads to restoration of wild-type physiology.PLoS Genet. 2013 Apr;9(4):e1003427. doi: 10.1371/journal.pgen.1003427. Epub 2013 Apr 4. PLoS Genet. 2013. PMID: 23593025 Free PMC article.
-
Laboratory divergence of Methylobacterium extorquens AM1 through unintended domestication and past selection for antibiotic resistance.BMC Microbiol. 2014 Jan 2;14:2. doi: 10.1186/1471-2180-14-2. BMC Microbiol. 2014. PMID: 24384040 Free PMC article.
-
Fast growth increases the selective advantage of a mutation arising recurrently during evolution under metal limitation.PLoS Genet. 2009 Sep;5(9):e1000652. doi: 10.1371/journal.pgen.1000652. Epub 2009 Sep 18. PLoS Genet. 2009. PMID: 19763169 Free PMC article.
-
Metabolomics Revealed an Association of Metabolite Changes and Defective Growth in Methylobacterium extorquens AM1 Overexpressing ecm during Growth on Methanol.PLoS One. 2016 Apr 26;11(4):e0154043. doi: 10.1371/journal.pone.0154043. eCollection 2016. PLoS One. 2016. PMID: 27116459 Free PMC article.
-
Production of 3-hydroxypropionic acid in engineered Methylobacterium extorquens AM1 and its reassimilation through a reductive route.Microb Cell Fact. 2017 Oct 30;16(1):179. doi: 10.1186/s12934-017-0798-2. Microb Cell Fact. 2017. PMID: 29084554 Free PMC article.
Cited by
-
Evolution after introduction of a novel metabolic pathway consistently leads to restoration of wild-type physiology.PLoS Genet. 2013 Apr;9(4):e1003427. doi: 10.1371/journal.pgen.1003427. Epub 2013 Apr 4. PLoS Genet. 2013. PMID: 23593025 Free PMC article.
-
Parallel and Divergent Evolutionary Solutions for the Optimization of an Engineered Central Metabolism in Methylobacterium extorquens AM1.Microorganisms. 2015 Apr 9;3(2):152-74. doi: 10.3390/microorganisms3020152. Microorganisms. 2015. PMID: 27682084 Free PMC article.
-
Development of an optimized medium, strain and high-throughput culturing methods for Methylobacterium extorquens.PLoS One. 2013 Apr 30;8(4):e62957. doi: 10.1371/journal.pone.0062957. Print 2013. PLoS One. 2013. PMID: 23646164 Free PMC article.
-
Stability of Cross-Feeding Polymorphisms in Microbial Communities.PLoS Comput Biol. 2016 Dec 30;12(12):e1005269. doi: 10.1371/journal.pcbi.1005269. eCollection 2016 Dec. PLoS Comput Biol. 2016. PMID: 28036324 Free PMC article.
-
Variation in the fitness effects of mutations with population density and size in Escherichia coli.PLoS One. 2014 Aug 14;9(8):e105369. doi: 10.1371/journal.pone.0105369. eCollection 2014. PLoS One. 2014. PMID: 25121498 Free PMC article.
References
-
- Vasi F, Travisano M, Lenski RE. Long-term experimental evolution in Escherichia coli. II. Changes in life-history traits during adaptation to a seasonal environment. Am Nat. 1994;144:432–456. doi: 10.1086/285685. - DOI
Publication types
MeSH terms
Grants and funding
LinkOut - more resources
Full Text Sources
Research Materials
