. 2012 Jul 4;14(4):R159.
doi: 10.1186/ar3899.

Transglutaminase 2 cross-linking activity is linked to invadopodia formation and cartilage breakdown in arthritis

Transglutaminase 2 cross-linking activity is linked to invadopodia formation and cartilage breakdown in arthritis

Annie Lauzier et al. Arthritis Res Ther. .

Abstract

Introduction: The microenvironment surrounding inflamed synovium leads to the activation of fibroblast-like synoviocytes (FLSs), which are important contributors to cartilage destruction in rheumatoid arthritic (RA) joints. Transglutaminase 2 (TG2), an enzyme involved in extracellular matrix (ECM) cross-linking and remodeling, is activated by inflammatory signals. This study was undertaken to assess the potential contribution of TG2 to FLS-induced cartilage degradation.

Methods: Transglutaminase (TGase) activity and collagen degradation were assessed with the immunohistochemistry of control, collagen-induced arthritic (CIA) or TG2 knockdown (shRNA)-treated joint tissues. TGase activity in control (C-FLS) and arthritic (A-FLS) rat FLSs was measured by in situ 5-(biotinamido)-pentylamine incorporation. Invadopodia formation and functions were measured in rat FLSs and cells from normal (control; C-FLS) and RA patients (RA-FLS) by in situ ECM degradation. Immunoblotting, enzyme-linked immunosorbent assay (ELISA), and p3TP-Lux reporter assays were used to assess transforming growth factor-β (TGF-β) production and activation.

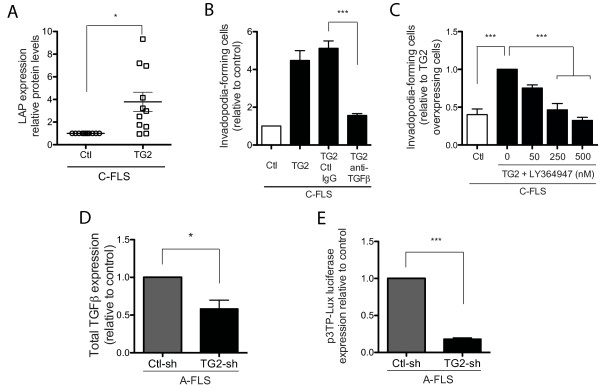
Results: TG2 and TGase activity were associated with cartilage degradation in CIA joints. In contrast, TGase activity and cartilage degradation were reduced in joints by TG2 knockdown. A-FLSs displayed higher TGase activity and TG2 expression in ECM than did C-FLSs. TG2 knockdown or TGase inhibition resulted in reduced invadopodia formation in rat and human arthritic FLSs. In contrast, increased invadopodia formation was noted in response to TGase activity induced by TGF-β, dithiothreitol (DTT), or TG2 overexpression. TG2-induced increases in invadopodia formation were blocked by TGF-β neutralization or inhibition of TGF-βR1.

Conclusions: TG2, through its TGase activity, is required for ECM degradation in arthritic FLS and CIA joints. Our findings provide a potential target to prevent cartilage degradation in RA.


Figures

Figure 1
Figure 1
The formation of ε-(γ-glutamyl)-lysine bonds is associated with collagen degradation in CIA. Images (40× magnification) of representative zones of synovial membrane/cartilage from articular tissue sections of control and arthritic rats at different times (18, 28, and 32 days) after immunization with type II collagen. Tissues were immunostained with (A) ε-(γ-glutamyl)-lysine bond antibody and hematoxylin or (B) degraded collagen antibody. Associated graphs show relative labeling intensity calculated from six random fields for each tissue section in the synovial membrane (upper graphs) or in the cartilage (lower graphs). Each column represents mean value ± SEM of total fields from two different tissue sections per individual rat (Ctl, n = 4; CIA, n = 8). (C) Representative images (10× magnification) of immunostaining of ε-(γ-glutamyl)-lysine bonds (red), degraded collagen (blue), and double labeling (purple) in successive CIA tissue sections (*cartilage; **bone).
Figure 2
Figure 2
TG2 knockdown reduces collagen degradation in CIA rats. Representative images (10× magnification) of immunostaining of (A) TG2, (B) ε-(γ-glutamyl)-lysine bonds, and (C) degraded collagen in the synovial membranes from control rats (PBS; n = 5), CIA rats injected with control (CIA+Ctl-sh; n = 6), or TG2 (CIA+TG2-sh; n = 5) shRNA-expressing lentivirus. Associated graphs show relative labeling intensities for these experimental groups and CIA control (n = 4) rats, calculated from three random fields for each tissue section. Values are expressed as the mean ± SEM (***P < 0.001).
Figure 3
Figure 3
TG2 expression and matrix degradation are increased in FLSs from CIA rats. (A) Control FLSs (C-FLSs) and arthritic FLSs (A-FLSs) were cultured for 72 hours, and TG2 in the ECM laid down by the cells was visualized with immunoblotting. Graph shows the densitometric analysis of TG2/actin ratio (n = 4) with representative immunoblot (insert). (B) C-FLSs and A-FLSs were cultured on gelatin, and TGase activity was measured by using in situ 5-(biotinamido)-pentylamine incorporation assay. Graph shows mean labeling intensities of 20 cells per experiment (n = 3). (C) Representative confocal microscopy image (60×) of the basal surface of the cell showing localization of endogenous F-actin (red), p-cortactin (blue), and TG2 (green) and overlay of the three channels (merge) in RA-FLSs grown on gelatin for 16 hours. Arrows show the position of the actin and p-cortactin dots that colocalize with TG2. (D through G) A-FLSs were transfected with FXIIIa-, TG2-, or their respective control (scrambled)-shRNA-expressing lentivirus. (D) The percentage of invadopodia-forming cells was counted for 100 GFP-expressing cells (TG2-shRNA) or 300 cells (FXIIIa-shRNA), and (E) the mean area of degradation per cell was calculated for 25 transfected cells (n = 3). (F) Representative immunoblot of TG2 or FXIIIa and actin showing knockdown with respective shRNA. (G) In situ TGase activity was measured in a minimum of 20 cells (n = 3). Values are expressed as the mean ± SEM (*P < 0.05; **P < 0.01; ***P < 0.001).
Figure 4
Figure 4
TGase activity of TG2 is involved in in vitro matrix degradation by FLSs. (A) C-FLSs were incubated with TGF-β (20 ng/ml), DTT (1 mM), or cystamine (100 μM ). After 3 hours, TG2 expression was evaluated with Western blotting (n = 2), and TGase activity was measured for cells incubated on gelatin matrix (n = 7). (B) C-FLSs or C-FLSs transfected with TG2-shRNA-expressing lentivirus or (C) A-FLSs were cultured on a gelatin matrix, incubated with TGF-β (20 ng/ml), DTT (1 mM), cystamine (10 or 100 μM), KCC-009 (25 or 250 μM), or Z-DON (1 or 100 μM), and the percentage of cells forming invadopodia at 24 hours was counted for 300 cells per experiment (n = 3). (D, E) C-FLSs were transfected with wild-type TG2 (TG2 WT), TG2-W241A, or empty vector and cultured on gelatin for 24 hours. (D) The percentage of cells forming invadopodia for 100 transfected cells (overexpressing TG2) per experiment (n = 3) and (E) the mean area of degradation per cell calculated for 25 transfected cells (n = 3) is shown. (F) Human C-FLSs treated with TGF-β (5 and 10 ng/ml) or DTT (0.1 and 1 mM) or (G) synoviocytes from patients with rheumatoid arthritis (RA-FLSs) transfected with GFP-tagged control- or TG2-shRNA-expressing lentivirus or treated with cystamine (10 and 100 μM) were grown on gelatin, and the percentage of GFP-expressing invadopodia-forming cells was counted at 24 hours (n = 3). Values are expressed as the mean ± SEM (*P < 0.05; **P < 0.01; ***P < 0.001).
Figure 5
Figure 5
TGase-mediated induction of matrix degradation is modulated by TGF-β in FLSs. (A-C) C-FLSs were transfected with TG2 or empty vector. (A) Immunoblot analysis using anti-LAP antibody in cell lysates. Densitometric measurements of LAP-to-actin ratios are shown (n = 11). (B) Cells were deposited on a gelatin matrix and incubated with control (Ctl)-IgG or anti-TGF-β antibodies. After 24 hours, the percentage of invadopodia-forming cells was counted (n = 4). (C) Cells were deposited on a gelatin matrix and incubated for 24 hours with LY-364947 (50 nM to 500 nM), and the percentage of invadopodia-forming cells was counted (n = 4). (D, E) Arthritic FLSs were transfected with control- or TG2-shRNA-expressing lentivirus. (D) Total TGF-β was measured with ELISA (n = 4). (E) shRNA-expressing cells were transiently transfected with p3TP-LuX, and luciferase assays were performed (n = 4). Values are expressed as the mean ± SEM (*P < 0.05; ***P < 0.001).

Similar articles

Cited by

References

    1. Noss EH, Brenner MB. The role and therapeutic implications of fibroblast-like synoviocytes in inflammation and cartilage erosion in rheumatoid arthritis. Immunol Rev. 2008;223:252–270. doi: 10.1111/j.1600-065X.2008.00648.x. - DOI - PubMed
    1. Nanki T, Nagasaka K, Hayashida K, Saita Y, Miyasaka N. Chemokines regulate IL-6 and IL-8 production by fibroblast-like synoviocytes from patients with rheumatoid arthritis. J Immunol. 2001;167:5381–5385. - PubMed
    1. Nakahara H, Song J, Sugimoto M, Hagihara K, Kishimoto T, Yoshizaki K, Nishimoto N. Anti-interleukin-6 receptor antibody therapy reduces vascular endothelial growth factor production in rheumatoid arthritis. Arthritis Rheum. 2003;48:1521–1529. doi: 10.1002/art.11143. - DOI - PubMed
    1. Garcia-Vicuna R, Gomez-Gaviro MV, Dominguez-Luis MJ, Pec MK, Gonzalez-Alvaro I, Alvaro-Gracia JM, Diaz-Gonzalez F. CC and CXC chemokine receptors mediate migration, proliferation, and matrix metalloproteinase production by fibroblast-like synoviocytes from rheumatoid arthritis patients. Arthritis Rheum. 2004;50:3866–3877. doi: 10.1002/art.20615. - DOI - PubMed
    1. Remmers EF, Lafyatis R, Kumkumian GK, Case JP, Roberts AB, Sporn MB, Wilder RL. Cytokines and growth regulation of synoviocytes from patients with rheumatoid arthritis and rats with streptococcal cell wall arthritis. Growth Factors. 1990;2:179–188. - PubMed

Publication types

Substances

LinkOut - more resources