Altered spatial learning, cortical plasticity and hippocampal anatomy in a neurodevelopmental model of schizophrenia-related endophenotypes
- PMID: 22762562
- PMCID: PMC3902091
- DOI: 10.1111/j.1460-9568.2012.08204.x
Altered spatial learning, cortical plasticity and hippocampal anatomy in a neurodevelopmental model of schizophrenia-related endophenotypes
Abstract
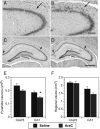
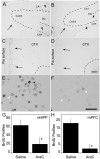
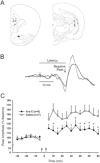
Adult rats exposed to the DNA-methylating agent methylazoxymethanol on embryonic day 17 show a pattern of neurobiological deficits that model some of the neuropathological and behavioral changes observed in schizophrenia. Although it is generally assumed that these changes reflect targeted disruption of embryonic neurogenesis, it is unknown whether these effects generalise to other antimitotic agents administered at different stages of development. In the present study, neurochemical, behavioral and electrophysiological techniques were used to determine whether exposure to the antimitotic agent Ara-C later in development recapitulates some of the changes observed in methylazoxymethanol (MAM)-treated animals and in patients with schizophrenia. Male rats exposed to Ara-C (30 mg/kg/day) at embryonic days 19.5 and 20.5 show reduced cell numbers and heterotopias in hippocampal CA1 and CA2/3 regions, respectively, as well as cell loss in the superficial layers of the pre- and infralimbic cortex. Birth date labeling with bromodeoxyuridine reveals that the cytoarchitectural changes in CA2/3 are a consequence rather that a direct result of disrupted cortical neurogenesis. Ara-C-treated rats possess elevated levels of cortical dopamine and DOPAC (3,4-didyhydroxypheylacetic acid) but no change in norepinephrine or serotonin. Ara-C-treated rats are impaired in their ability to learn the Morris water maze task and showed diminished synaptic plasticity in the hippocampocortical pathway. These data indicate that disruption of neurogenesis at embryonic days 19.5 and 20.5 constitutes a useful model for the comparative study of deficits observed in other gestational models and their relationship to cognitive changes observed in schizophrenia.
© 2012 The Authors. European Journal of Neuroscience © 2012 Federation of European Neuroscience Societies and Blackwell Publishing Ltd.
Figures


Similar articles
-
Memory deficits with intact cognitive control in the methylazoxymethanol acetate (MAM) exposure model of neurodevelopmental insult.Neurobiol Learn Mem. 2016 Oct;134 Pt B(Pt B):294-303. doi: 10.1016/j.nlm.2016.07.034. Epub 2016 Jul 30. Neurobiol Learn Mem. 2016. PMID: 27485950 Free PMC article.
-
Altered prepulse inhibition in rats treated prenatally with the antimitotic Ara-C: an animal model for sensorimotor gating deficits in schizophrenia.Psychopharmacology (Berl). 2004 Jul;174(2):177-89. doi: 10.1007/s00213-003-1757-7. Psychopharmacology (Berl). 2004. PMID: 14985933
-
Alterations in hippocampal excitability, synaptic transmission and synaptic plasticity in a neurodevelopmental model of schizophrenia.Neuropharmacology. 2012 Mar;62(3):1349-58. doi: 10.1016/j.neuropharm.2011.08.005. Epub 2011 Aug 16. Neuropharmacology. 2012. PMID: 21854789
-
Using animal models to test a neurodevelopmental hypothesis of schizophrenia.J Psychiatry Neurosci. 2004 Jul;29(4):282-6. J Psychiatry Neurosci. 2004. PMID: 15309044 Free PMC article. Review.
-
Synaptic plasticity/dysplasticity, process memory and item memory in rodent models of mental dysfunction.Schizophr Res. 2019 May;207:22-36. doi: 10.1016/j.schres.2018.08.025. Epub 2018 Aug 31. Schizophr Res. 2019. PMID: 30174252 Free PMC article. Review.
Cited by
-
Effects of low concentration of fluoride exposure during fetal on behavior and neurotransmitters in adult mice.Biomed Rep. 2025 Mar 5;22(5):81. doi: 10.3892/br.2025.1959. eCollection 2025 May. Biomed Rep. 2025. PMID: 40151797 Free PMC article.
-
Combination of Resting State fMRI, DTI, and sMRI Data to Discriminate Schizophrenia by N-way MCCA + jICA.Front Hum Neurosci. 2013 May 29;7:235. doi: 10.3389/fnhum.2013.00235. eCollection 2013. Front Hum Neurosci. 2013. PMID: 23755002 Free PMC article.
-
From gut dysbiosis to altered brain function and mental illness: mechanisms and pathways.Mol Psychiatry. 2016 Jun;21(6):738-48. doi: 10.1038/mp.2016.50. Epub 2016 Apr 19. Mol Psychiatry. 2016. PMID: 27090305 Free PMC article. Review.
References
-
- Arnold SE, Franz BR, Gur RC, Gur RE, Shapiro RM, Moberg PJ, Trojanowski JQ. Smaller neuron size in schizophrenia in hippocampal subfields that mediate cortical-hippocampal interactions. Am J Psychiatry. 1995;152:738–748. - PubMed
-
- Bayer SA, Altman J, Russo RJ, Zhang X. Timetables of neurogenesis in the human brain based on experimentally determined patterns in the rat. Neurotoxicology. 1993;14:83–144. - PubMed
-
- Benes FM, Sorensen I, Bird ED. Reduced neuronal size in posterior hippocampus of schizophrenic patients. Schizophr Bull. 1991;17:597–608. - PubMed
-
- Boos HB, Aleman A, Cahn W, Hulshoff Pol H, Kahn RS. Brain volumes in relatives of patients with schizophrenia: a meta-analysis. Arch Gen Psychiatry. 2007;64:297–304. - PubMed
Publication types
MeSH terms
Substances
Grants and funding
LinkOut - more resources
Full Text Sources
Medical
Miscellaneous

