. 2012 Aug;139(16):2935-44.
doi: 10.1242/dev.081471. Epub 2012 Jul 4.

Multiscale mechanisms of cell migration during development: theory and experiment

Affiliations

Multiscale mechanisms of cell migration during development: theory and experiment

Rebecca McLennan et al. Development. 2012 Aug.

Abstract

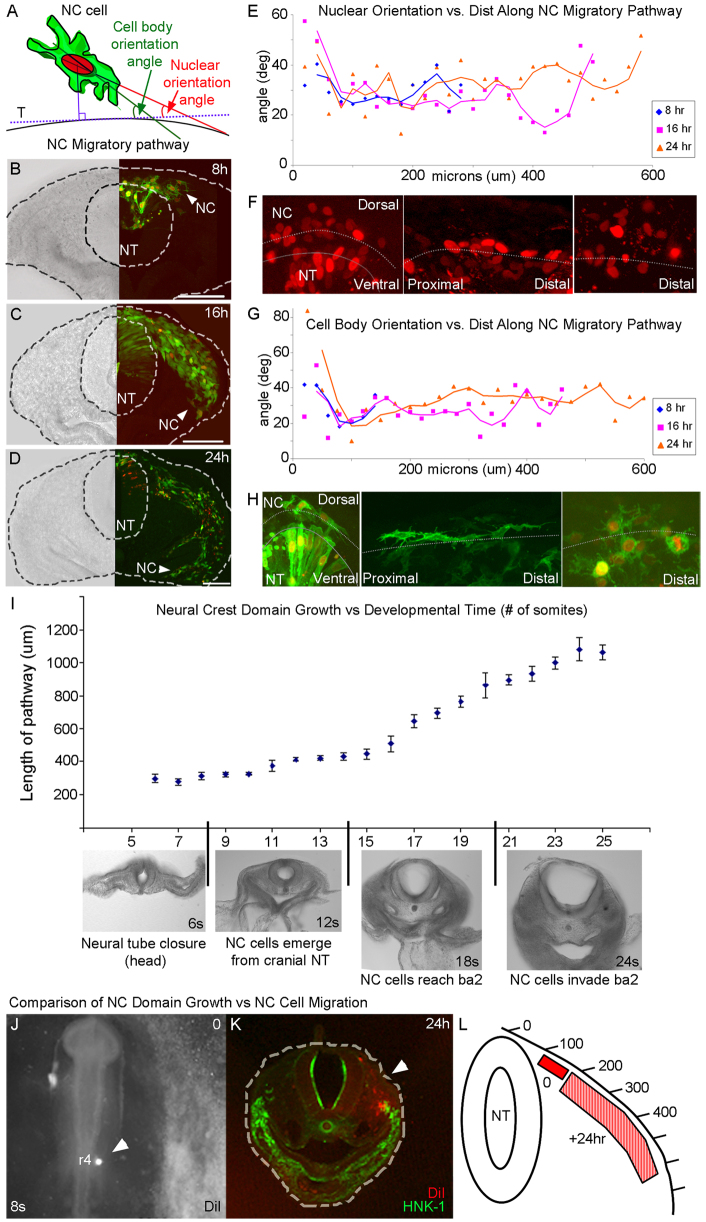
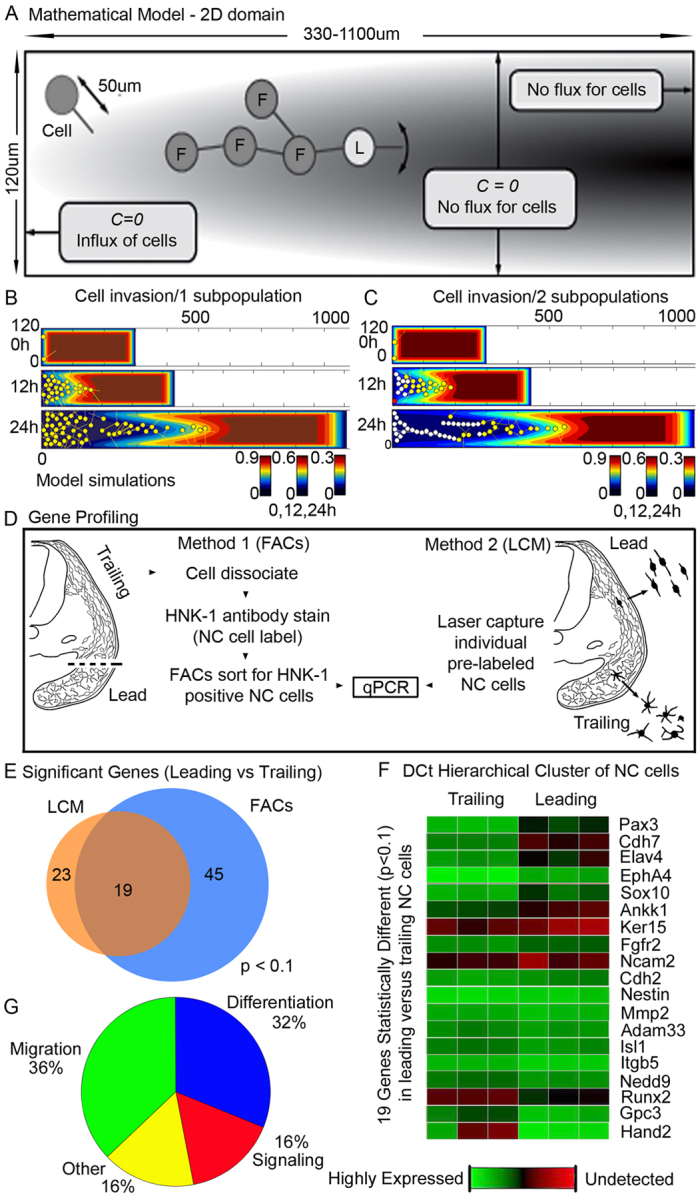
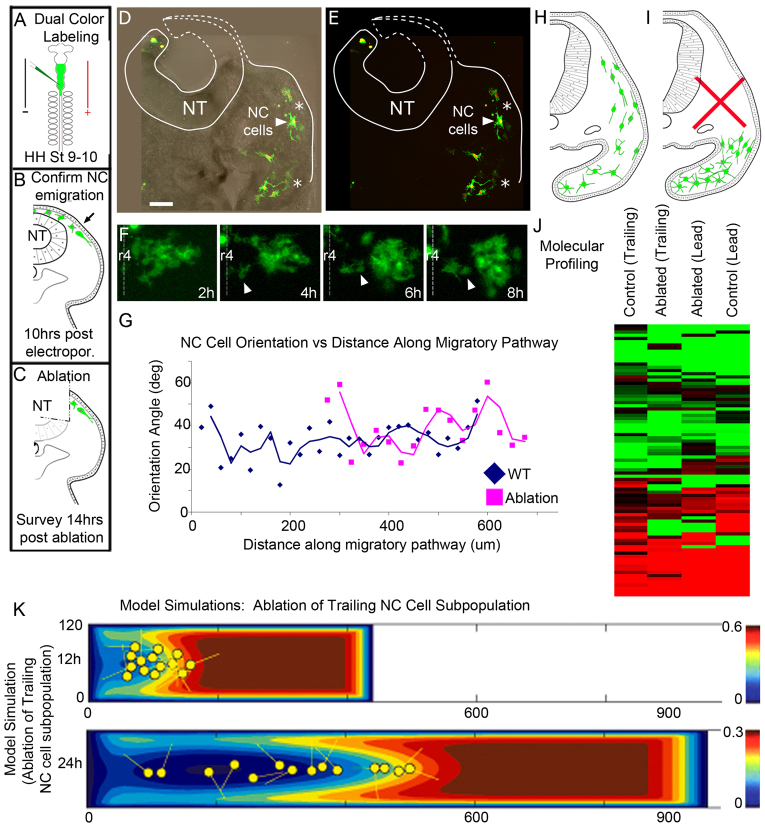
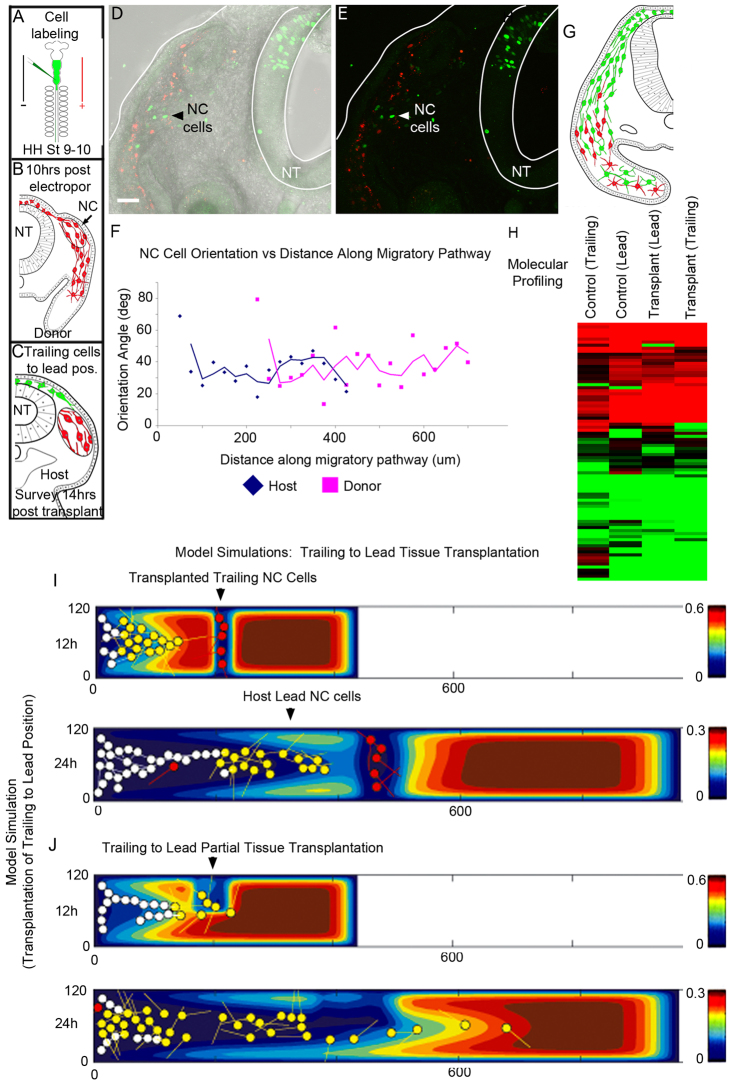
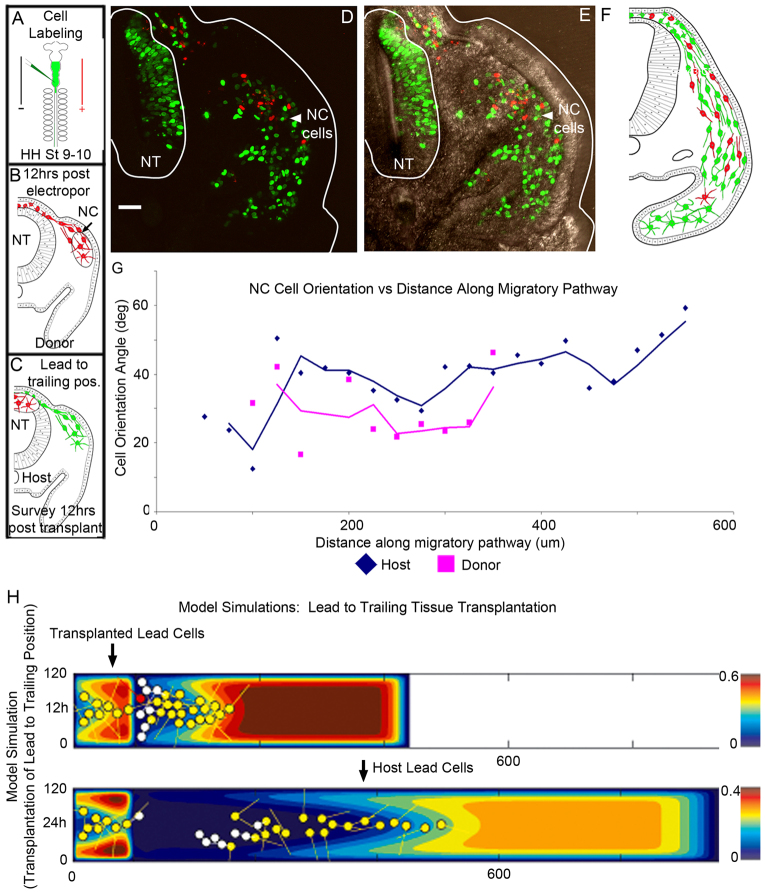
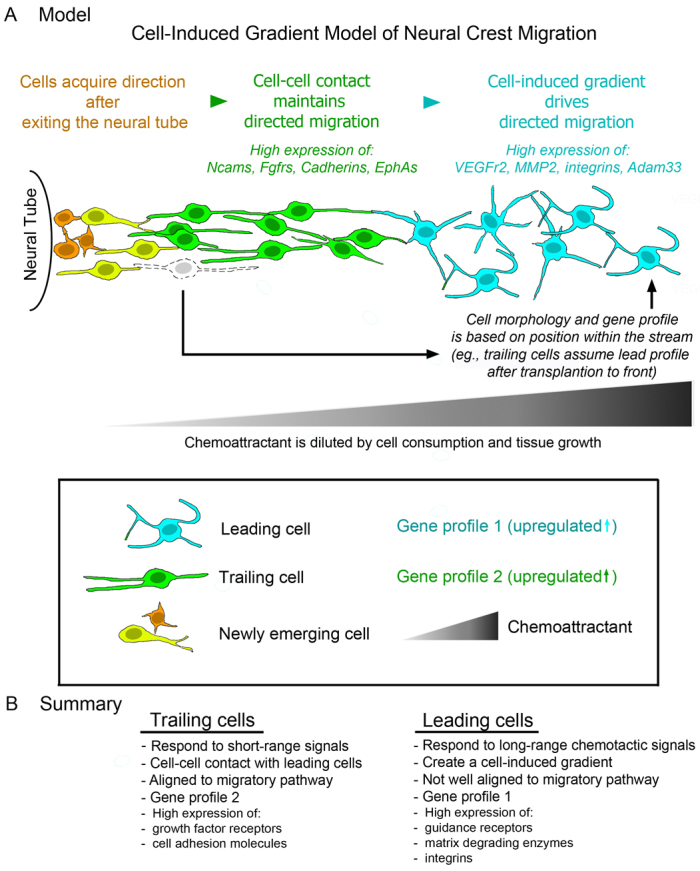
Long-distance cell migration is an important feature of embryonic development, adult morphogenesis and cancer, yet the mechanisms that drive subpopulations of cells to distinct targets are poorly understood. Here, we use the embryonic neural crest (NC) in tandem with theoretical studies to evaluate model mechanisms of long-distance cell migration. We find that a simple chemotaxis model is insufficient to explain our experimental data. Instead, model simulations predict that NC cell migration requires leading cells to respond to long-range guidance signals and trailing cells to short-range cues in order to maintain a directed, multicellular stream. Experiments confirm differences in leading versus trailing NC cell subpopulations, manifested in unique cell orientation and gene expression patterns that respond to non-linear tissue growth of the migratory domain. Ablation experiments that delete the trailing NC cell subpopulation reveal that leading NC cells distribute all along the migratory pathway and develop a leading/trailing cellular orientation and gene expression profile that is predicted by model simulations. Transplantation experiments and model predictions that move trailing NC cells to the migratory front, or vice versa, reveal that cells adopt a gene expression profile and cell behaviors corresponding to the new position within the migratory stream. These results offer a mechanistic model in which leading cells create and respond to a cell-induced chemotactic gradient and transmit guidance information to trailing cells that use short-range signals to move in a directional manner.


Figures

Fig. 1.
Fig. 1.
NC cell direction is acquired after cells exit the neural tube and cells move faster than non-linear tissue growth. (A) Orientation angle measurements. (B-D) Typical projected images from 3D confocal z-stacks of transverse sections through the r4 NC cell migratory stream at 8, 16 and 24 hours after electroporation. (E) Average nuclear orientation angle with respect to distance along the migratory route from 8- (n=318 cells, 29 embryos), 16- (n=346 cells, 15 embryos) and 24- (n=240 cells, 25 embryos) hour data. (F) Representative images of migratory NC cells. (G) Average cell body orientation angle with respect to distance along the migratory route for 8- (n=89 cells, 10 embryos), 16- (n=254 cells, 27 embryos) and 24- (n=248 cells, 11 embryos) hour data. (H) Gap43-EGFP membrane-labeled NC cells. (I) Average length of the NC cell migratory domain at increasing developmental times. (J) Focal injection (arrowhead) of DiI into the lateral mesoderm prior to NC cell emigration. (K) Twenty four hours after injection in J. Arrowhead indicates site of injection. (L) Average spread of DiI-labeled tissue. Scale bars: 100 μm. NC, neural crest; NT, neural tube.
Fig. 2.
Fig. 2.
The NC cell migratory stream is composed of leading and trailing cells rather than a homogeneous population. (A) Mathematical model schematic. (B) Model simulation of NC cell migration. (C) Model simulation of NC cell migration [two subpopulations; leaders (yellow) that respond to microenvironmental signals and trailers (red)]. Trailers that respond to directional cues from leaders turn white. (D) Gene profiling by FACs and LCM. (E) The number of genes that are significantly (P<0.1) different between leading and trailing NC cells when isolated by LCM or FACs. (F) DCt hierarchical cluster analysis. (G) The distribution of the 19 significant (P<0.1) genes displayed in F.
Fig. 3.
Fig. 3.
Leading NC cells compensate for the loss of trailing NC cells after trailing ablation. (A-C) Experiment schematic. (D,E) Transverse sections after ablation (dotted line; asterisks indicate where ‘lead’ and ‘trailing’ NC cells were isolated using LCM). (F) Selected images from time-lapse of NC cell migration after ablation. (G) Average nuclear orientation angles with respect to distance along the migratory route after ablation (168 cells, seven embryos). (H,I) Possible expected outcomes after ablation. (J) Heat map of qPCR molecular profiles of LCM-isolated NC cells. (K) Model simulations after ablation. Scale bar: 50 μm. NC, neural crest cells; NT, neural tube; WT, wild type; hr, hours.
Fig. 4.
Fig. 4.
Behavior and molecular profile of trailing NC cells transplanted to the leading position of the migratory stream. (A-C) Experimental schematic. (D,E) Transverse sections after transplantation. (F) Average nuclear orientation angles with respect to distance along the migratory route [72 host cells (blue), 128 donor cells (pink), 12 embryos]. (G) Schematic representation of cell migration after transplantation. (H) Heat map of qPCR molecular profiles of LCM-isolated NC cells. (I) Model simulation. Leaders (yellow), trailers that are following others (white) and trailers that are not following others (red). (J) Model simulation. Tissue transplant is half the width of the domain. Trailing cells given the ability to become leading cells. Scale bar: 50 μm. NC, neural crest cells; NT, neural tube; hr, hours.
Fig. 5.
Fig. 5.
Very few leading NC cells migrate after leading to trailing transplant. (A-C) Experiment schematic. (D,E) Transverse sections after tissue transplantation, also represented schematically (F). (G) Average nuclear orientation angles after trailing NC cell ablation [169 host cells (blue), 37 donor cells (pink), 3/13 embryos]. (H) Model simulation. Leaders (yellow), trailers that are following others (white) and trailers that are not following others (red). Scale bar: 50 μm. NC, neural crest cells; NT, neural tube; hr, hours.
Fig. 6.
Fig. 6.
Neural crest cell migration: a cell-induced chemotaxis model. (A) NC cells exit the NT without orientation to the migratory pathway (orange cells), but rapidly acquire direction (yellow cells). Leading NC cells (blue) respond to long-range chemotactic signals, including VEGF. Leading cells spread out from the migratory pathway and have a distinct gene profile that is navigation oriented. Trailing NC cells (green) respond to short-range signals for guidance information from other local migratory NC cells. Trailing NC cells are highly aligned with the migratory pathway and have a distinct gene profile that is cell-cell contact oriented. Ablation and tissue transplantation studies, demonstrate that both trailing and leading NC cells have a high degree of plasticity. Key shows the NC cell types and gene profiles of leading and trailing cells. (B) Summary details differences in the features of the leading and trailing NC cells.

References

    1. Abercrombie M. (1979). Contact inhibition and malignancy. Nature 281, 259–262 - PubMed
    1. Aman A., Piotrowski T. (2010). Cell migration during morphogenesis. Dev. Biol. 341, 20–33 - PubMed
    1. Burns T. C., Steinberg G. K. (2011). Stem cells and stroke: opportunities, challenges and strategies. Expert Opin. Biol. Ther. 11, 447–461 - PMC - PubMed
    1. Cai H., Huang C. H., Devreotes P. N., Iijima M. (2012). Analysis of chemotaxis in Dictyostelium. Methods Mol. Biol. 757, 451–468 - PMC - PubMed
    1. Carmona-Fontaine C., Matthews H. K., Kuriyama S., Moreno M., Dunn G. A., Parsons M., Stern C. D., Mayor R. (2008). Contact inhibition of locomotion in vivo controls neural crest directional migration. Nature 456, 957–961 - PMC - PubMed

Publication types