. 2012 Jul 5;3(7):e339.
doi: 10.1038/cddis.2012.80.

Low molecular weight, non-peptidic agonists of TrkA receptor with NGF-mimetic activity

Affiliations

Low molecular weight, non-peptidic agonists of TrkA receptor with NGF-mimetic activity

D Scarpi et al. Cell Death Dis. .

Erratum in

  • Low molecular weight, non-peptidic agonists of TrkA receptor with NGF-mimetic activity.
    Scarpi D, Cirelli D, Matrone C, Castronovo G, Rosini P, Occhiato EG, Romano F, Bartali L, Clemente AM, Bottegoni G, Cavalli A, De Chiara G, Bonini P, Calissano P, Palamara AT, Garaci E, Torcia MG, Guarna A, Cozzolino F. Scarpi D, et al. Cell Death Dis. 2012 Sep 6;3(9):e389. doi: 10.1038/cddis.2012.129. Cell Death Dis. 2012. PMID: 22951986 Free PMC article.

Abstract

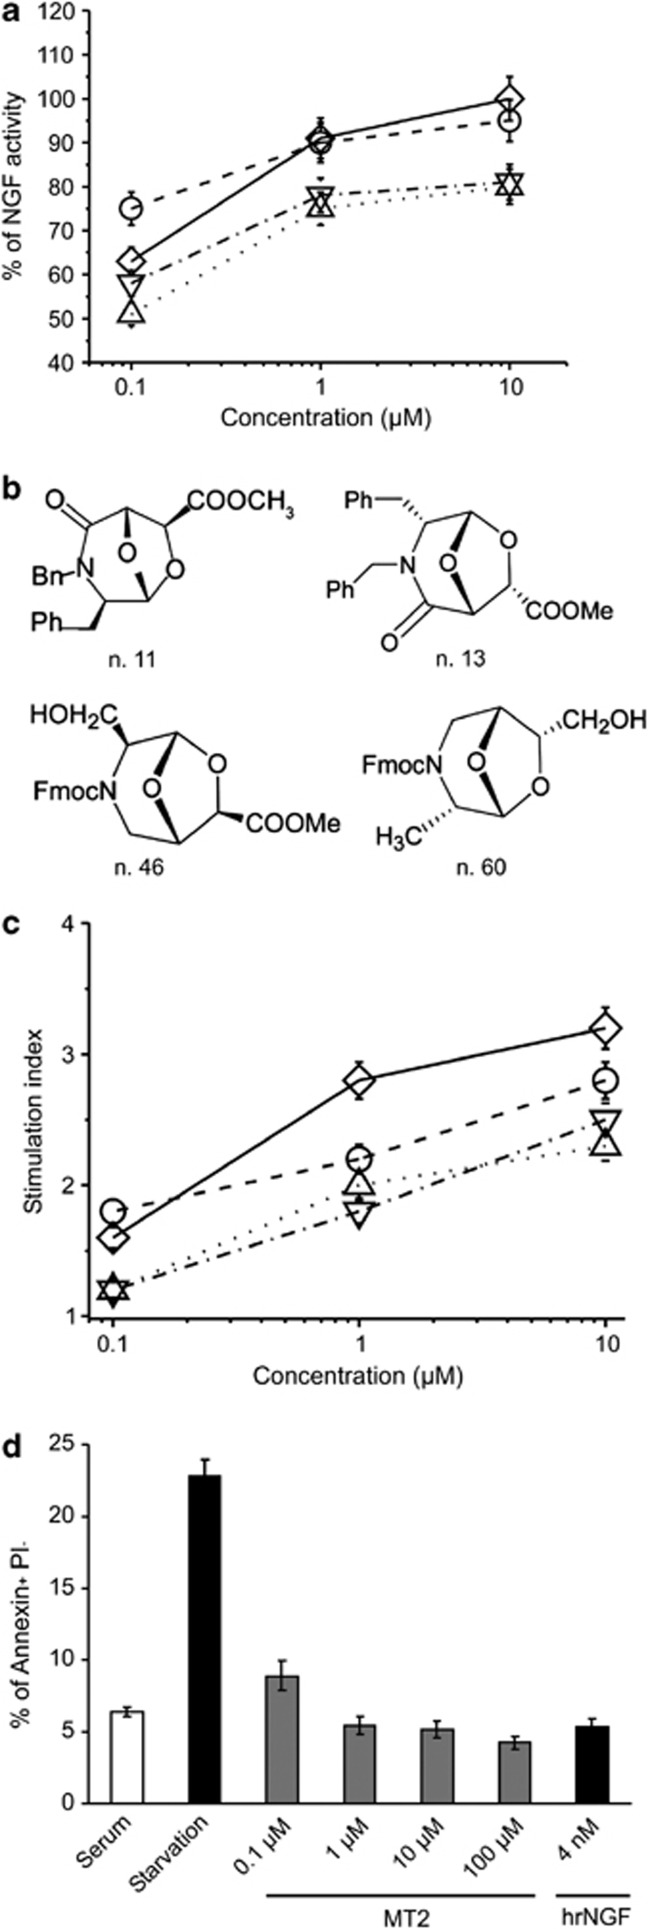
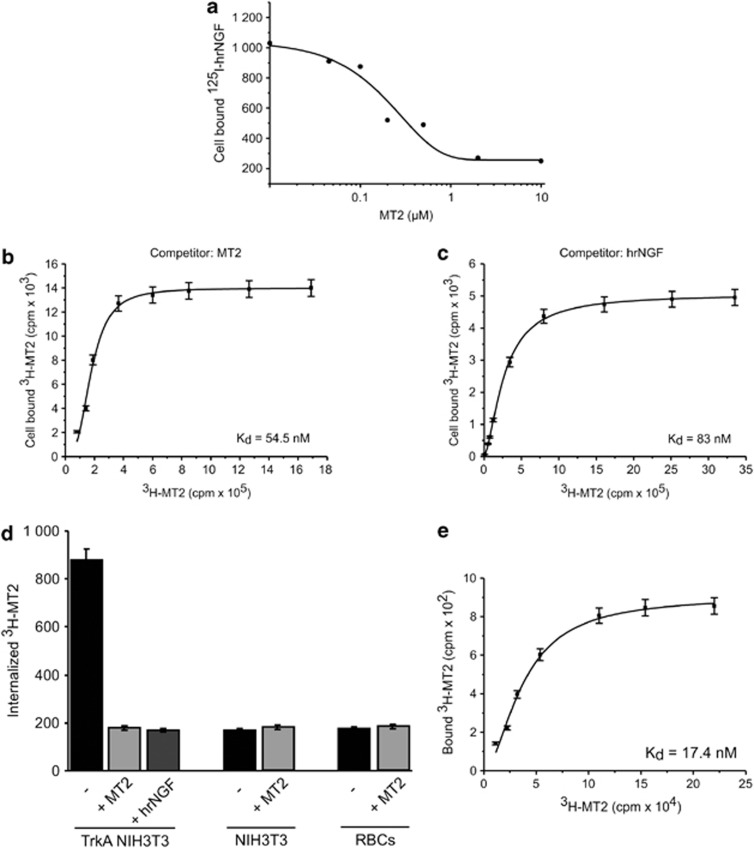
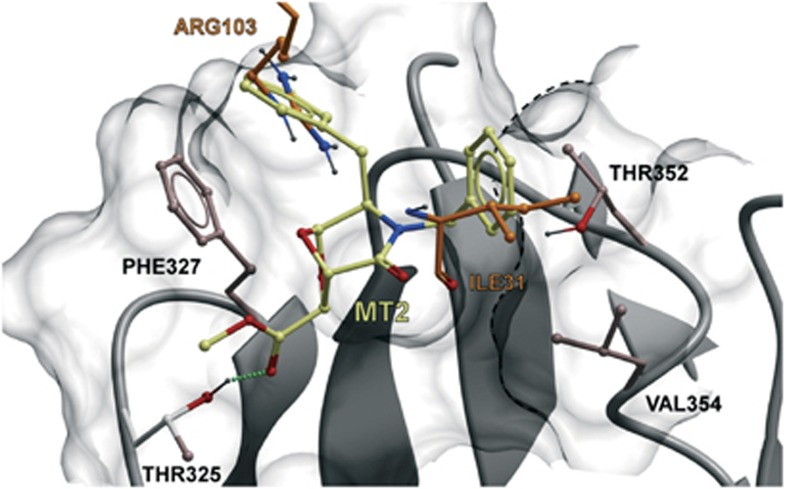
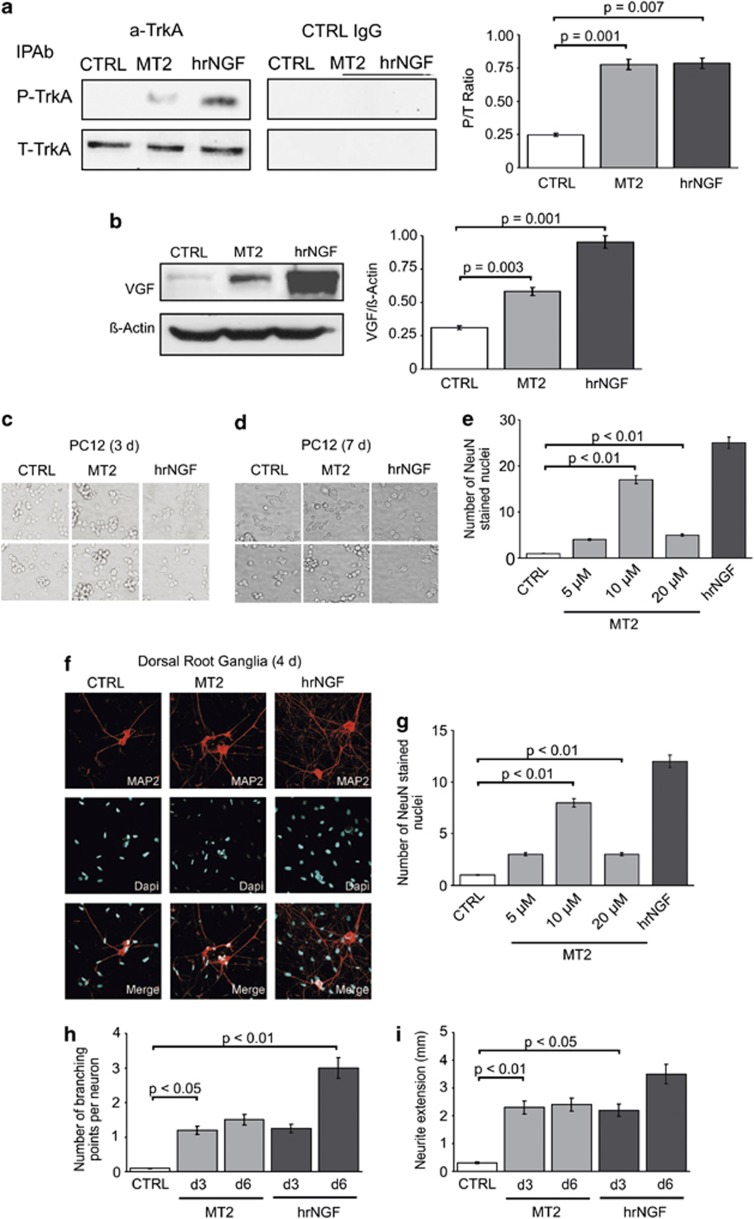
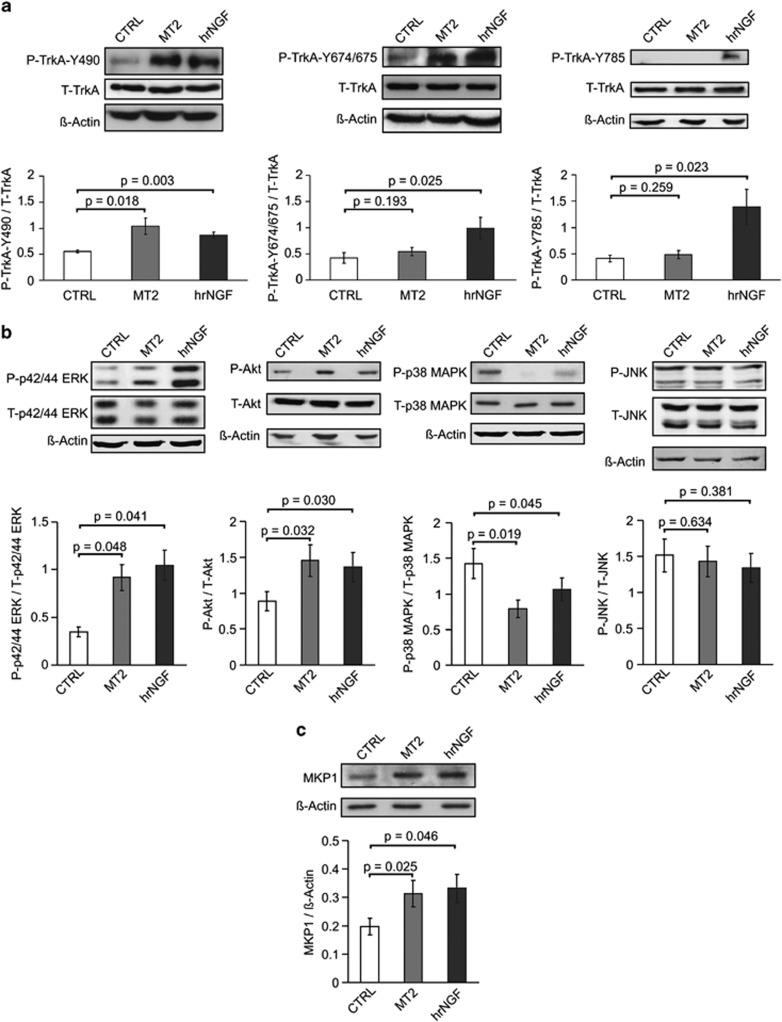
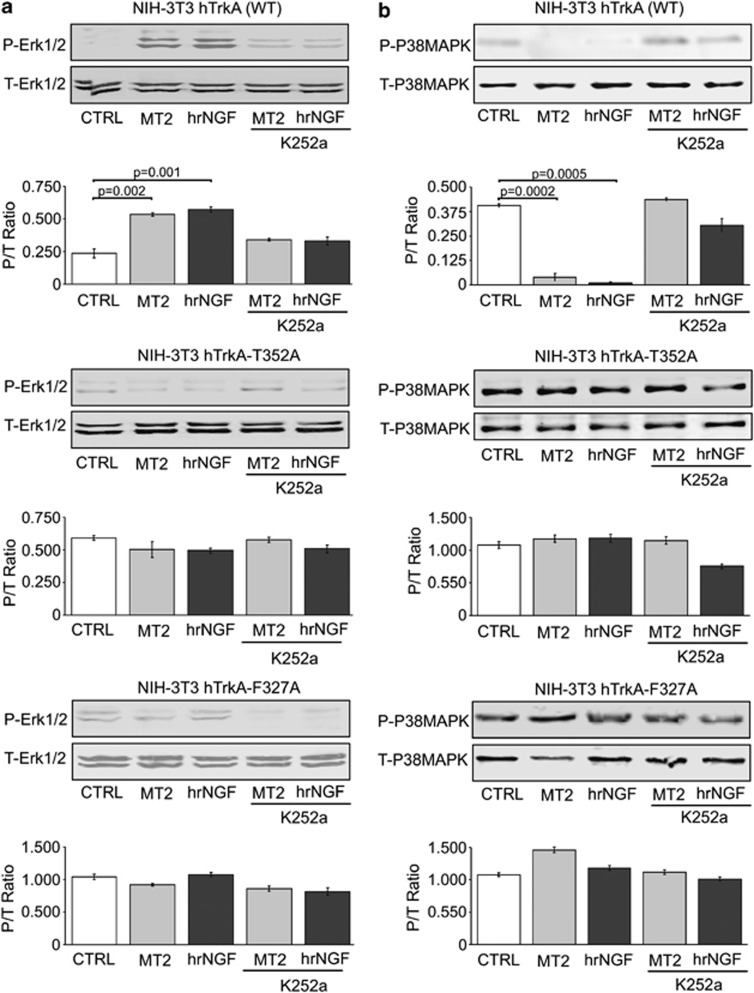
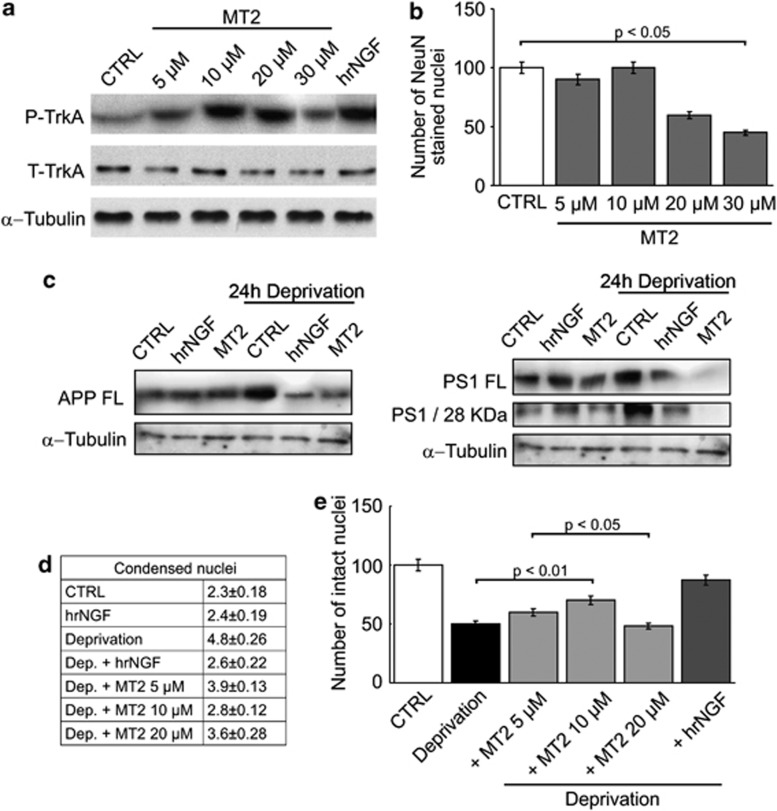
Exploitation of the biologic activity of neurotrophins is desirable for medical purposes, but their protein nature intrinsically bears adverse pharmacokinetic properties. Here, we report synthesis and biologic characterization of a novel class of low molecular weight, non-peptidic compounds with NGF (nerve growth factor)-mimetic properties. MT2, a representative compound, bound to Trk (tropomyosin kinase receptor)A chain on NGF-sensitive cells, as well as in cell-free assays, at nanomolar concentrations and induced TrkA autophosphorylation and receptor-mediated internalization. MT2 binding involved at least two amino-acid residues within TrkA molecule. Like NGF, MT2 increased phosphorylation of extracellular signal-regulated kinase1/2 and Akt proteins and production of MKP-1 phosphatase (dual specificity phosphatase 1), modulated p38 mitogen-activated protein kinase activation, sustained survival of serum-starved PC12 or RDG cells, and promoted their differentiation. However, the intensity of such responses was heterogenous, as the ability of maintaining survival was equally possessed by NGF and MT2, whereas the induction of differentiation was expressed at definitely lower levels by the mimetic. Analysis of TrkA autophosphorylation patterns induced by MT2 revealed a strong tyrosine (Tyr)490 and a limited Tyr785 and Tyr674/675 activation, findings coherent with the observed functional divarication. Consistently, in an NGF-deprived rat hippocampal neuronal model of Alzheimer Disease, MT2 could correct the biochemical abnormalities and sustain cell survival. Thus, NGF mimetics may reveal interesting investigational tools in neurobiology, as well as promising drug candidates.


Figures

Figure 1
Figure 1
NGF mimetic activity of selected compounds. (a) PC12 cells were cultured for 72 h in serum-free medium in the presence or absence of the indicated concentrations of compounds n. 11 (○), 13 (▵), 46 (▽), 60 (◊), or 4 nM hrNGF as positive control. Cell survival was measured as MTT incorporation of triplicate cultures and expressed as percentage of the survival activity induced by hrNGF. Results of four different experiments (mean±S.E.) are reported. (b) Structural formula of the compounds n. 11, 13, 46, 60. Compound n. 11 was named MT2. (c) PC3 cells were cultured for 48 h in the presence or absence of the indicated concentrations of compounds n. (○), 13 (▵), 46 (▽), 60 (◊) or 4 nM hrNGF as positive control. Data are expressed as stimulation index (3H-TdR incorporation in stimulated cultures/3H-TdR incorporation in unstimulated cultures). Stimulation index obtained with 4 nM of hrNGF was 2.3±0.18 (mean±S.E.). Results of three different experiments (mean±S.E.) are reported. (d) Effect of MT2 on apoptosis induced by serum starvation. PC12 cells were cultured in serum-free medium in the presence or absence of different concentrations of MT2 or 4 nM hrNGF as positive control. Cells were washed, stained with FITC Annexin V/PI and the percentage of Annexin+ PI cells recorded by cytofluorimetry. Statistical analysis, performed by Student's t-test shows significant differences (P at least <0.01) between untreated versus treated (any concentration) starved cultures
Figure 2
Figure 2
MT2 interactions with TrkA. (a) Displacement of 125I-hrNGF bound to PC12 cells by MT2. PC12 cells were incubated with 0.1 nM 125I-hrNGF in the presence or absence of different concentrations of MT2. Specific cell bound radioactivity was calculated and the results analyzed by Origin software. Results of one representative experiment out of three performed are shown. (b and c) Binding of 3H-MT2 to TrkA NIH-3T3. NIH-3T3, stably transfected with full-length human TrkA, were incubated in triplicate with different concentrations of 3H-MT2, in the presence or absence of excess cold MT2 (b) or 4 nM cold hrNGF (c). Specific cell bound radioactivity was calculated and the results analyzed by the Origin software (one-site binding assay). No specific binding was recorded on mock-transfected NIH-3T3 cells (not shown). (d) Internalization of 3H-MT2. TrkA-NIH-3T3 or mock-transfected cells were incubated for 1 h at 4° C with 3H-MT2 in the presence or absence of excess cold MT2 or hrNGF. Then, cells were washed and brought at 37° C for 1 h. Membrane radioactivity was eluted with 0.1 M glycine buffer, pH 2.8. RBC were incubated for 1 h at 37° C with 3H-MT2 in the presence or absence of excess cold MT2 or hrNGF. Cells were lysed, and cell-bound radioactivity recorded. Data are expressed as mean bound radioactivity±S.E. of triplicate cultures. Results of one representative experiments out of three performed are shown. (e) MT2 interaction with the ECD fraction of human recombinant TrkA. One microgram purified TrkA ECD was incubated in triplicate with different concentrations of 3H-MT2, in the presence or absence of excess cold MT2. The mixture was absorbed on filter papers and, after washing, the radioactivity recorded. Data were analyzed by Origin software. Results from one representative experiments out of three performed are shown
Figure 3
Figure 3
Binding sites of MT2 in TrkA molecule. In silico prediction of amino-acid residues involved. The predicted bound conformation of MT2 at the binding site of TrkA is shown. The surface of the pocket is reported explicitly with the structure of TrkA in gray ribbons as background. The amino acids of TrkA that establish direct interaction with MT2 are displayed in ball and stick representation. MT2 is displayed in ball and stick with carbon atoms colored dark yellow. As a term of comparison, Arg103 and Ile31 of NGF are reported in ball and stick with the carbon atoms colored orange. The H-bond between Thr325 of TrkA and MT2 is highlighted with green dots. The van der Waals volume of part of Thr352 and Val354 side chains is highlighted with a black dotted line
Figure 4
Figure 4
NGF mimetic activities expressed by MT2. (a) Effect of MT2 on TrkA autophosphorylation. PC12 cells were incubated with 10 μM MT2 or 4 nM hrNGF. Cell lysates were immunoprecipitated with a-TrkA or with control IgG antibodies, blotted on nitrocellulose filter, and stained with anti-PY antibodies. (b) Effect of MT2 on VGF production by PC12 cells. PC12 cells, stimulated with 10 μM MT2 or 4 nM hrNGF, were lysed, blotted, and stained with anti-VGF antibodies. Results of one representative experiment out of three performed are shown in a and b. (c–e) MT2 induces an NGF-like growth arrest in PC12 cells. Cells were exposed to MT2 (5–20 μM) and the number of neuronal nuclei stained with a specific neuronal marker (NeuN) was assessed after 7 days. (c and d) phase contrast microscope analysis of PC12 cells exposed to MT2 10 μM for 3 (c) or 7 days (d). At day 3, MT2- exposed PC12 cells appear to be aggregated into clumps with shorter and limited numbers of neuritic processes, compared with the corresponding NGF-differentiated (2 nM) samples (c). All these events appear more prominent at day 7, where most of MT2-treated cells are aggregated to form larger clusters, with neuritic processes significantly shorter than those observed in the corresponding NGF-treated cells (d); (e) number of NeuN+ cells after 7 days of culture (n=6). Ten micromolar MT2 results to be the highest active concentration. (fi) NGF-like neuronal differentiating activity in DRG neurons: (f) Neuronal nuclei were assessed following stimulation for 4 days with MT2 (10 μM) and hrNGF (2 nM). MAP2 positive neuritic processes are stained in red (scale bar: 25 μm). (g) Neuronal nuclei assessed following 4 days of stimulation with MT2 (5–20 μM) and hrNGF (2 nM). (h-i) The number of branching points (h) and Neurite extension (i) in cells stimulated with 2 nM NGF or 10 μM MT2 were recorded after the indicated times. Images were analyzed using the Olympus inverted microscope (Olympus Corporation, Tokyo, Japan) or NIH ImageJ (NIH, Bethesda, MD, USA). Neurites were viewed with a × 20 objective, images were projected onto a video monitor, and neurite lengths were traced with a digitizing tablet while being viewed on the monitor. Ten DRG neurons were analyzed for each slide and the experiments were repeated at least three times. Statistical significance was determined with independent t-test and one-way ANOVA. For distribution, the data were presented as mean S.E.M.
Figure 5
Figure 5
Biochemical pathways induced by MT2 in PC12 cells. (a) TrkA phosphorylation. Serum-starved PC12 cells were stimulated with 10 μM MT2, or 4 nM hrNGF as positive control, for 15 min. Cells lysates were blotted with antibodies to P-Y490, P-Y674/675, P-Y785 and with anti-actin as loading control. Membranes were stripped and stained with anti-total TrkA IgG. The relative histograms represent the data of densitometric analysis and are expressed as the ratio between phosphoprotein (P) and total protein (T) of five different experiments (mean±S.E.). Statistical analysis was performed by paired Student's t-test. (b) Kinases phosphorylation. Serum-starved PC12 cells were stimulated with 10 μM MT2, or 4 nM hrNGF, for 30 min. Cell lysates were blotted with rabbit anti-P-ERK, anti-P-Akt, anti-P-p38 MAPK, anti-P-JNK. Then, membranes were stripped and stained with antibodies to the respective total protein and with anti-actin antibodies as loading control. The relative histograms represent the data of densitometric analysis and are expressed as the ratio between phosphoprotein (P) and total protein (T) of five different experiments (mean±S.E.). Statistical analysis was performed by paired Student's t-test. (c) Phosphatase. Serum-starved PC12 cells were stimulated with 10 μM MT2, or 4 nM hrNGF as positive control, for 30 min. Cell lysates were blotted with rabbit anti-MKP1 IgG and anti-actin antibodies as loading control. The relative histogram represents the data of densitometric analysis and is expressed as the ratio between MKP1 expression and actin of five different experiments (mean±S.E.). Statistical analysis was performed by paired Student's t-test
Figure 6
Figure 6
Biochemical pathways induced by MT2 in WT TrkA-NIH-3T3 or mutants. NIH-3T3 cells, stably transfected with full-length WT human TrkA, T352A, or F327A TrkA mutants, were cultured in serum-free medium and incubated with 10 μM MT2 or 4 nM hrNGF, in the presence or absence of K252a. Cell lysates were blotted with rabbit anti-P-ERK (a) and anti-P-p38 MAPK (b). Then, membranes were stripped and stained with antibodies to the respective total protein. The relative histograms represent the densitometric analysis. Data are expressed as ratio between phosphoprotein (P) and total protein (T) of three different experiments (mean±S.E.). Statistical analysis was performed by paired Student's t-test
Figure 7
Figure 7
MT2 protects neurons from Aβ amyloid-mediated death in NGF-deficient neurons. (a and b) 3–4 days cultured hippocampal neurons were exposed to 2 nM NGF or to MT2 (5–30 μM) and the highest active concentration of MT2 evaluated as induction of TrkA phosphorylation by western blot analysis with anti-phosphorylated (P) and anti total (T) Trk-A antibodies or by counting the number of NeuN stained nuclei (b). (c and d) hippocampal neurons were deprived of NGF by exposure to anti-NGF antibodies (30 μg/ml) for 24 h and incubated in the presence or absence of 10 μM MT2 or 2 nM hrNGF. Cells were lysed and western blot analysis performed with antibodies against APP full-length (c) and PS1 28 kDa N-terminal fragment (d). (e and f) Hippocampal neurons were deprived of NGF by exposure to anti-NGF antibodies (30 μg/ml) for 24 h and then treated with concentrations of MT2 ranging from 5 to 30 μM or 2 nM hrNGF. The percentage of alive neurons was obtained by counting the number of intact nuclei (d) or alternatively by counting the number of condensed nuclei (e). Ctrl, neurons not exposed to NGF or MT2; NGF, neurons exposed for 48 h to NGF; MT2, neurons exposed for 48 h to MT2 (10 μM); Dep, neurons deprived of NGF for 24 hours; Dep+NGF, neurons washed with NGF-free media and immediately exposed to NGF containing media; Dep+MT2 neurons washed with NGF-free media and immediately exposed to MT2-containing media. Statistical analysis was performed by Newman–Keuls test (N=4), P<0.05. Consistent with the inhibition of the amyloidogenic pathway, neurons were completely protected from death

Similar articles

Cited by

References

    1. Reichardt LF. Neurotrophin-regulated signalling pathways. Philos Trans R Soc Lond B Biol Sci. 2006;361:1545–1564. - PMC - PubMed
    1. Caporali A, Emanueli C. Cardiovascular actions of neurotrophins. Physiol Rev. 2009;89:279–308. - PMC - PubMed
    1. Barker PA. High affinity not in the vicinity. Neuron. 2007;53:1–4. - PubMed
    1. Wehrman T, He X, Raab B, Dukipatti A, Blau H, Garcia KC. Structural and mechanistic insights into nerve growth factor interactions with the TrkA and p75 receptors. Neuron. 2007;53:25–38. - PubMed
    1. Wiesmann C, Ultsch MH, Bass SH, de Vos AM. Crystal structure of nerve growth factor in complex with the ligand-binding domain of the TrkA receptor. Nature. 1999;401:184–188. - PubMed

Publication types

MeSH terms