. 2012 Jul 4;32(27):9143-58.
doi: 10.1523/JNEUROSCI.0416-12.2012.

Spectraplakins promote microtubule-mediated axonal growth by functioning as structural microtubule-associated proteins and EB1-dependent +TIPs (tip interacting proteins)

Affiliations

Spectraplakins promote microtubule-mediated axonal growth by functioning as structural microtubule-associated proteins and EB1-dependent +TIPs (tip interacting proteins)

Juliana Alves-Silva et al. J Neurosci. .

Abstract

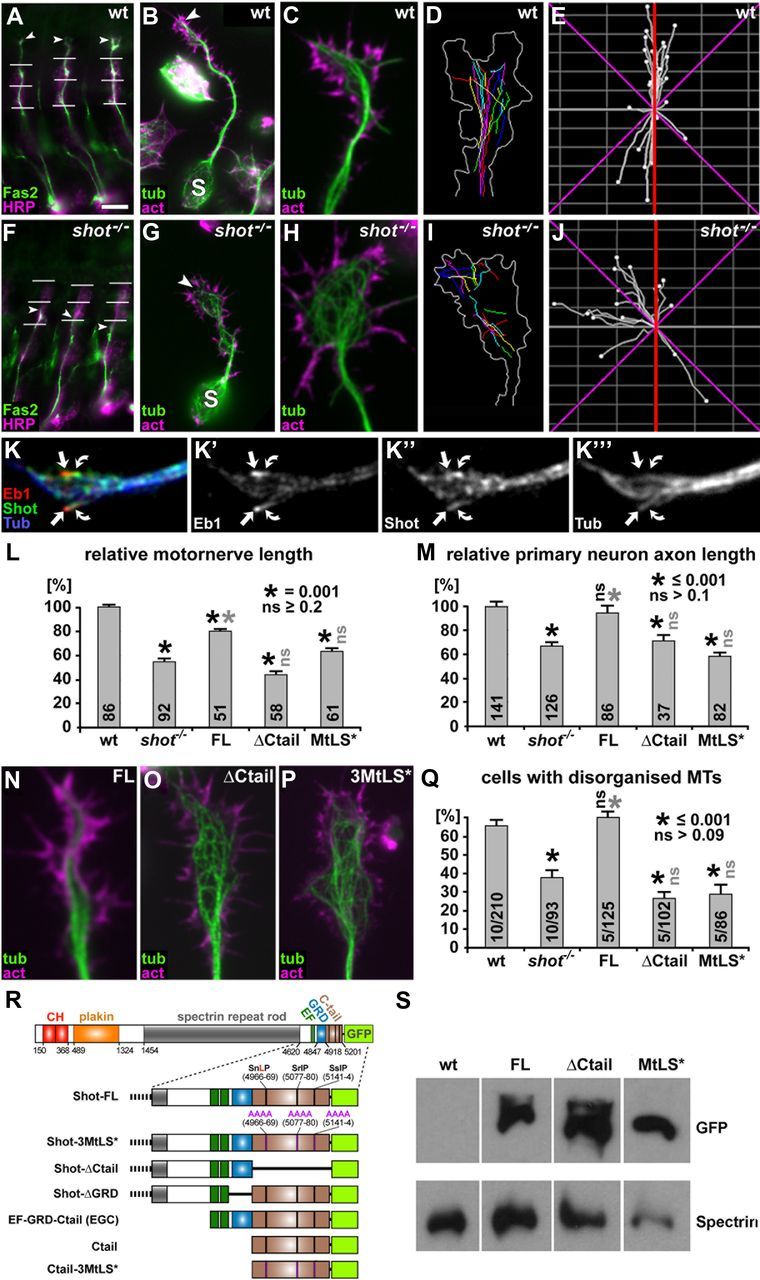
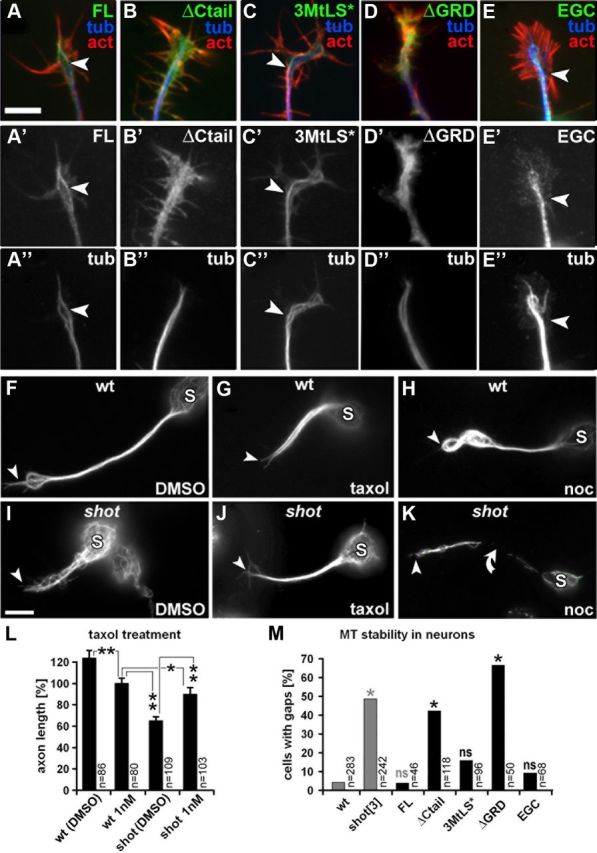
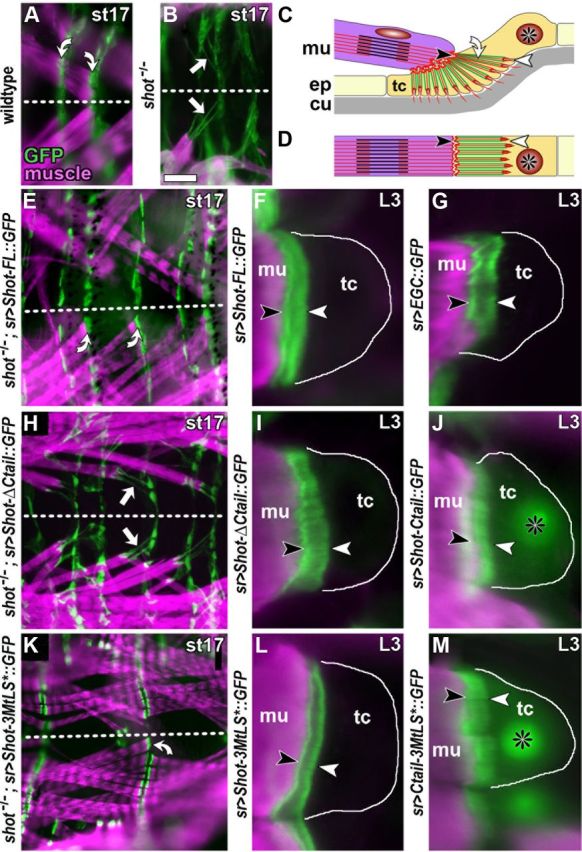
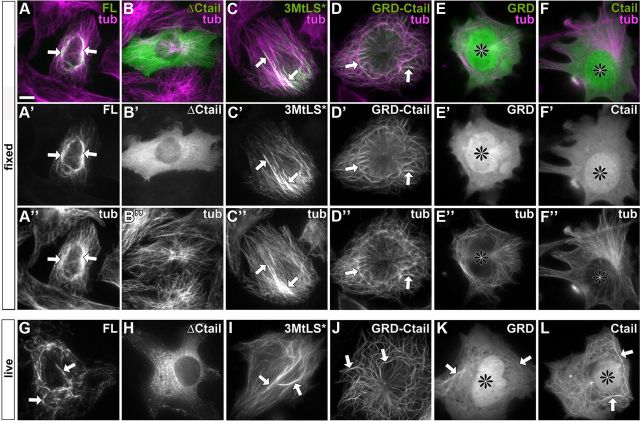
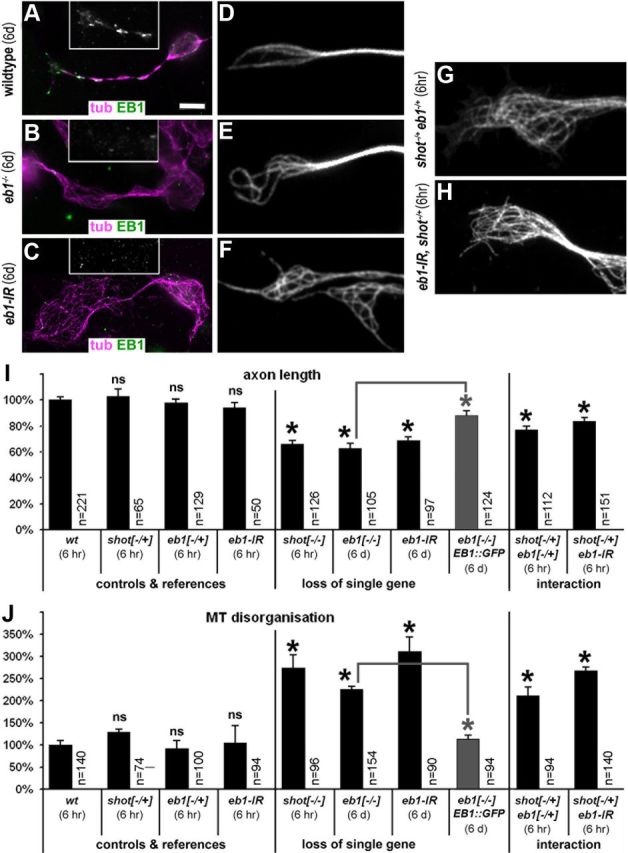
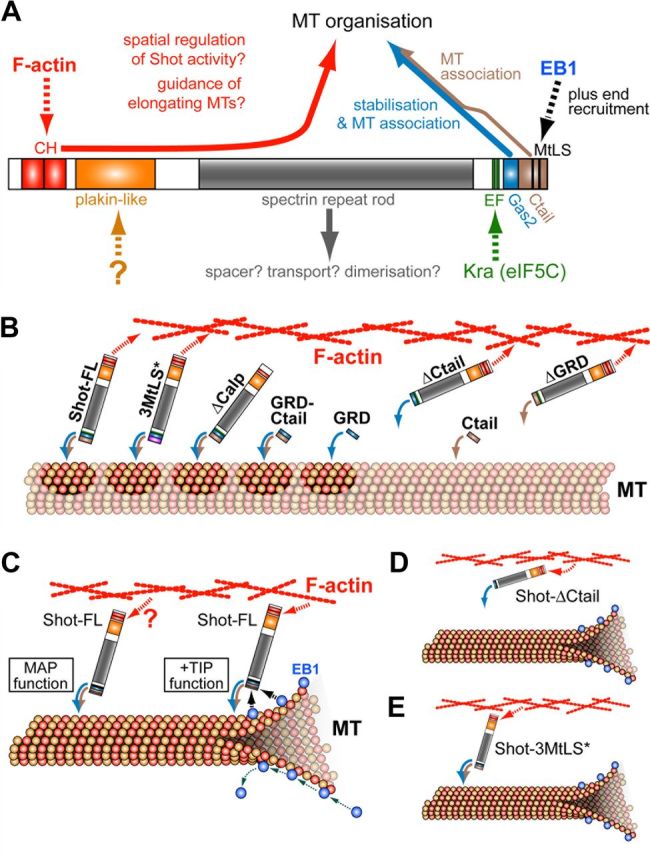
The correct outgrowth of axons is essential for the development and regeneration of nervous systems. Axon growth is primarily driven by microtubules. Key regulators of microtubules in this context are the spectraplakins, a family of evolutionarily conserved actin-microtubule linkers. Loss of function of the mouse spectraplakin ACF7 or of its close Drosophila homolog Short stop/Shot similarly cause severe axon shortening and microtubule disorganization. How spectraplakins perform these functions is not known. Here we show that axonal growth-promoting roles of Shot require interaction with EB1 (End binding protein) at polymerizing plus ends of microtubules. We show that binding of Shot to EB1 requires SxIP motifs in Shot's C-terminal tail (Ctail), mutations of these motifs abolish Shot functions in axonal growth, loss of EB1 function phenocopies Shot loss, and genetic interaction studies reveal strong functional links between Shot and EB1 in axonal growth and microtubule organization. In addition, we report that Shot localizes along microtubule shafts and stabilizes them against pharmacologically induced depolymerization. This function is EB1-independent but requires net positive charges within Ctail which essentially contribute to the microtubule shaft association of Shot. Therefore, spectraplakins are true members of two important classes of neuronal microtubule regulating proteins: +TIPs (tip interacting proteins; plus end regulators) and structural MAPs (microtubule-associated proteins). From our data we deduce a model that relates the different features of the spectraplakin C terminus to the two functions of Shot during axonal growth.


Figures

Figure 1.
Figure 1.
Ctail and MtLS motifs are required for axon growth and axonal MT organization in embryonic motor neurons in vivo and in primary embryonic neurons in culture. A–J, Illustrations of axonal phenotypes of wild-type (top) and shot−/− mutant neurons (bottom); stainings in A–C and F–H as indicated: act, phalloidin-labeled filamentous actin; Fas2, motor axonal marker Fasciclin 2; HRP, neuronal marker horseradish peroxidase; tub, tubulin. A and F show intersegmental motor nerves in three consecutive segments of the embryo which are shorter in the mutant (arrowheads, nerve tips; horizontal lines, indicators of ventrodorsal position as described in Materials and Methods); B and G show primary neurons after 6 h in culture with shorter axons in the mutant (S, somata; arrowheads, axon tips); C and H show close-ups of axonal growth cones of wt and shot−/− mutant primary neurons with disorganized MTs; D and I show traces of trajectories of polymerizing EB1-labeled MT plus ends (growth cone outline in white); E and J show directionality plots of the same growth cones with a higher degree of abaxial projections in the mutant (red lines indicate the axon axis, magenta lines represent 45° from the axon axis). K–K‴, Growth cones fixed with a specific protocol for MT plus end-associated proteins (Rogers et al., 2002) showing Shot at MT plus ends (green, curved arrows) trailing slightly behind EB1 (red, arrows) at the plus ends of MTs (blue). L, M, Quantifications of motor nerve lengths in embryos (see A, F) and axon lengths in primary neurons (see B, G) normalized to wild-type (wt); rescue experiments in shot−/− mutant embryos or neurons were performed with Shot-FL, Shot-ΔCtail and Shot-3MtLS*, as indicated; numbers in columns indicate the pooled numbers of assessed nerves or neurons; quantifications were statistically assessed by Kruskal–Wallis one-way ANOVA on Ranks (H = 181.593, 4 degrees of freedom, p ≤ 0.001 in L; H = 83.791, 4 degrees of freedom, p ≤ 0.001 in M) and Mann–Whitney rank sum test (black asterisks, significant when compared with wt; gray asterisks, significant when compared with shot−/−; black ns, not significant when compared with wt; gray ns, not significant when compared with shot−/−; values as indicated in insets). Note that rescues mediated by Shot-ΔCtail and Shot-3MtLS* show different trends in embryos and primary neurons, likely caused by distinct properties of these constructs in MT stabilization; Figure 2). N–P, Growth cones of 6 h shot−/− mutant primary neurons (compare H) expressing Shot-FL, Shot-ΔCtail or Shot-3MtLS*, as indicated. Q, Quantification of MT disorganization in 6 h primary neurons; numbers in columns indicate numbers of independent experiments (before slash) as well as overall numbers of assessed neurons (after slash); statistics as in L and M (Variance: H = 26.671, 4 degrees of freedom, p ≤ 0.001 in Q). R, Transgenic constructs of Shot-FL and its derivatives used for rescue experiments and localization studies (Figs. 1–4, 7; numbers refer to Ensembl ID FBpp0086744). S, Western blot analysis of embryos, wild-type or with sca-Gal4-mediated expression of Shot-FL, Shot-ΔCtail or Shot-3MtLS*, probed with anti-GFP and with anti-α-Spectrin as a loading control. Scale bars: (in A) A and F, 20 μm; (in B) B and G, 5 μm; C, D, H, I, N–P, 1 μm.
Figure 2.
Figure 2.
Shot confers stability to MTs through its C terminus. A–E″, Primary embryonic Drosophila neurons with targeted expression of transgenic Shot constructs (illustrated in Fig. 1R), stained for F-actin (red), tubulin (blue) and GFP (green); arrowheads point at obvious MT-association of the GFP-tagged Shot-FL and Shot-3MtLS* constructs. Note, that A′–C′ were taken with identical camera settings from parallel cell cultures, indicating that all constructs are equally well expressed. F–K, Anti-tubulin-stained primary neurons treated with taxol or nocodazole (noc), or control-treated with the vehicle DMSO. Somata are indicated by S, the tips of the axons by arrowheads, and the curved arrow points to a region of the axon devoid of microtubules. L, Quantification of axon lengths upon taxol treatment (**p ≤ 0.001, *p = 0.03, as determined by Mann–Whitney rank sum test). M, Quantification of destabilizing effects of nocodazole on axonal MTs of wt and shot−/− mutant primary neurons without targeted expression (gray) or of shot−/− mutant neurons expressing Shot constructs (black; constructs illustrated in Fig. 1R); χ2 tests (*p ≤ 0.004; ns, not significant p ≥ 0.01) were performed relative to wt (gray asterisks) or relative to FL (black asterisks). Scale bar (in A) A–E″, 2 μm; F–K, 5 μm.
Figure 3.
Figure 3.
Localization and rescue capability of mutant Shot constructs in tendon cells. A, A late stage 17 (st17) wild-type embryo in plain view (anterior left; dashed line indicates midline) displaying muscles (stained with phalloidin, magenta) which attach with their tips to tendon cells with prominent cytoskeletal arrays (curved arrows; stained with actin::GFP, green). B, In shot−/− mutant embryos, tendon cell integrity is affected as reflected by abnormal elongation of actin::GFP-labeled cytoskeletal arrays (white arrows). C, D, Diagrams illustrating tendon cell morphology in lateral (C) and plain (D) view; muscles (mu, magenta) attach to basal surfaces (black arrowheads) of tendon cells (tc; asterisks indicate nuclei), which are specialized cells of the epidermis (ep); apical tendon cell surfaces (white arrowhead) link to the exoskeleton called cuticle (cu, gray); apical and basal tendon cell surfaces are connected through cytoskeletal arrays (curved arrow) which are composed of parallel actin fibers (red) and MTs (green) and appear as a continuous band in horizontal view (D). E, H, K, Plain views of shot−/− mutant embryos with targeted expression of Shot-FL, Shot-ΔCtail or Shot-3MtLS (as indicated on the left); successful rescue of tendon cell integrity by Shot-FL and Shot-3MtLS is indicated by curved arrows in E and K, respectively; arrows point at stretched cytoskeletal arrays reflecting failed rescue through Shot-ΔCtail; a similar lack of rescue was observed for Shot-ΔGRD (Bottenberg et al., 2009). F, G, I, J, L, M, Images from late L3 larvae show muscle tips (magenta) attached to tendon cells (outlined with white line) which express different GFP-tagged constructs (green; as indicated on the left of each panel; all symbols and abbreviations as in C); Shot-FL, Shot-ΔCtail, Shot-3MtLS* and EGC all show strong association with cytoskeletal arrays with a slightly higher concentration at apical and basal ends. Strong MT association is surprising especially for Shot-ΔCtail, but similar observations were made for Shot-ΔGRD (Bottenberg et al., 2009); they might be explained through dimerization of these deletion constructs with endogenous Shot or interactions of N-terminal or central domains with other constituents proteins of cytoskeletal arrays. In contrast, Ctail and Ctail-3MtLS* show weaker and homogeneous localization at cytoskeletal arrays, and higher cytoplasmic and nuclear levels. Scale bar (in A) A, B, E, H, K, 40 μm; F, G, I, J, L, M, 7 μm.
Figure 4.
Figure 4.
Localization of GFP-tagged Shot constructs in fibroblasts. A–F″, Fixed fibroblasts transfected with GFP-tagged Shot constructs (green in A–F and gray in A′–F′) and stained for Tubulin (magenta in A–F and gray in A″–F″). G–L, Still images taken from live movies of cells expressing the same constructs as shown above: Shot-FL (G) and Shot-3MtLS* (I) usually associate with MTs in a discontinuous way; GRD-Ctail (J) prominently decorates MTs; GRD and Ctail (K, L) mildly associate with MTs although relatively high levels of proteins seem to be available in the cytoplasm (and tend to enrich also in nuclei; asterisks); Shot-ΔCtail shows no obvious MT association (H). Note that MT localization of GRD and Ctail is lost after fixation (E′, F′), further indicating their weak tendency to associate with MTs. Arrows indicate MT association throughout. Scale bar in A, 10 μm in all images.
Figure 5.
Figure 5.
N-terminal residues of the GRD significantly influence its MT association. A, Alignment of GRDs from various spectraplakins and Gas2-like molecules (taken from Ensembl) with the resolved structure of the GRD from mouse Gas2 (growth arrest specific 2; http://www.rcsb.org/pdb/explore/explore.do?structureId=1V5R). B, A different GRD construct (GRD**) used in previous publications (Lee and Kolodziej, 2002; Applewhite et al., 2010; construct kindly provided by S. Lee, Seoul National University, Seoul, Republic of Korea) shows much stronger MT association (indicated by black circle) than our GRD construct (gray circle). The GRD** construct lacks the 4 amino acids D-K-I-H of the first α helix, and adding these residues back (DKIH-GRD**) is sufficient to reduce the strength of MT association (gray circle). In contrast, the following modifications of the GRD construct did not change MT association: extending the linker region (GRD-pcDNA3), adding LRE from the Shot protein sequence (GRD-LRE), adding LRE and using the linker present in GRD** (Gas2-pEGFP). C–E, Images of fibroblasts expressing some of the above mentioned constructs. Scale bar in C, 10 μm in all images.
Figure 6.
Figure 6.
Association to MT shaft or plus end is determined by positive charge and MtLS motifs in the Ctail. A, Sequence of Ctail (Ensembl ID: FBpp0086744) illustrating the distribution of glycines (G), arginines (R) and serines (S), and the location of the three putative MtLS motifs (highlighted in gray). B–J″, Stills taken from live movies of fibroblasts expressing Shot domain constructs (as indicated); arrows point at MT plus end localization of GFP-constructs and/or EB3::RFP, open arrows indicate lack of MT plus end localization, and arrowheads show association along MT shafts; E–G, Ctail constructs with mutations of only subsets of their MtLS motifs imaged in the absence of additional markers showing that EB3 coexpression had no obvious impact on the localization of GFP-tagged constructs. K, C-terminal constructs of Shot that were analyzed in fibroblasts. L, M, Quantification of construct associations with MT shafts or MT plus ends; X indicates absence of any detectable association; Statistics were performed using Kruskal–Wallis one-way ANOVA on Ranks (H = 320.309 with 5 degrees of freedom, p ≤ 0.001 in H; H = 19.104 with 2 degrees of freedom, p ≤ 0.001 in I) and Mann–Whitney rank sum test (***p ≤ 0.001; NS, not significant; p > 0.05). Scale bar in B, 4 μm in all images.
Figure 7.
Figure 7.
Validating the requirement of MtLS motifs for EB1-mediated MT plus end localization. A, Coimmunoprecipitation analyses in Cos-7 cells. Top, Extracts of Cos-7 cells expressing GFP-tagged Ctail, Ctail-3MtLS*, GRD-Ctail or GRD-Ctail-3MtLS*, before (lysate) or after (IP) enrichment through immunoprecipitation with GFP-Trap as indicated. Ctail-GFP and GRD-Ctail-GFP are expected to be 68 and 79 kDa in size, respectively, and a tendency of the protein to degrade could be suppressed to tolerable levels; middle, coimmunoprecipitation of endogenous EB1 is observed only in IP samples of Ctail (lane 3) and GRD-Ctail (lane 7), but not in the corresponding MtLS-mutant versions (lanes 4 and 8, respectively); bottom, anti-α-Vinculin reveals comparable amounts of loaded cell lysate extracts and also serves as an unspecific control for the coimmunoprecipitation. B, C, In primary Drosophila neurons, Ctail but not Ctail-3MtLS* tracks MT plus ends. Scale bar (in B) B, C, 5 μm.
Figure 8.
Figure 8.
Shot regulates MT polymerization in primary neurons. A–D, Endogenous EB1 (A, B) and transgenic EB1::GFP (C, D) can be seen as comets (arrows) in wild-type (left) and shot−/− mutant neurons (right) alike; to generate the images C and D which illustrate examples of growing MTs, frames from time laps of EB1::GFP-expressing neurons were color-coded alternating in green and magenta and then merged together. E, F, Measurements of the life-time and velocity of EB1::GFP comets in wild-type (black) and shot−/− mutant neurons (dark gray), and in mutant neurons with targeted expression of Shot constructs (light gray), all normalized to wild-type. The 100% life-time equates to 4.31 frames ± 0.13 SEM (= 17.3 ± 0.52 s) and 100% velocity to 0.156 μm/s ± 0.003 SEM. Statistics were performed using Kruskal–Wallis one-way ANOVA on Ranks (H = 31.987, 3 degrees of freedom, p < 0.001 in F; H = 70.828, 3 degrees of freedom, p < 0.001 in G) and Mann–Whitney rank sum test (*indicates p ≤ 0.004; ns, not significant p > 0.05). Scale bar (in A) A, B, 8 μm; C, D, 4 μm.
Figure 9.
Figure 9.
EB1 is required for axonal growth and functionally interacts with Shot. A–C, EB1 protein levels in neurons after 6 d in culture are still high in wild-type neurons (A), whereas they are strongly reduced in eb104524 mutant (B) or eb1iRNA-expressing primary neurons (C). D–F, A high degree of curling, criss-crossed MTs is seen only in EB1-depleted neurons after 6 d in culture (compare E, F to D). G, H, However, if eb104524/04524 mutant or eb1iRNA-expressing neurons in addition carried one mutant copy of shot (shot−/+), axon shortening and MT disorganization were already identified after 6 h in culture. I, Quantification of axonal length. J, Quantification of neurons with disorganized microtubules. Statistics were assessed by Kruskal–Wallis one-way ANOVA on Ranks (H = 194.602, 9 degrees of freedom, p ≤ 0.001 in I; H = 56.061, 9 degrees of freedom, p ≤ 0.001 in H) and Mann–Whitney rank sum test (highly significant *p ≤ 0.001; ns, not significant; p > 0.3). Gray bars represent rescues of eb104524 mutant phenotypes with EB1::GFP. Scale bar (in A) A–C, 5 μm; D–H, 2.5 μm.
Figure 10.
Figure 10.
Model of Shot function in neuronal MT network organization. A, Molecular interactions (dashed arrows) and functions (solid arrows) of different Shot domains, as described here and previously (color code of arrows consistently used throughout the figure); apart from the C terminus, especially the calponin homology domains (CH) are crucial for Shot function in axonal growth and MT organization, and the EF hand domains are required for F-actin regulation in the context of pathfinding (Lee and Kolodziej, 2002; Bottenberg et al., 2009; Sánchez-Soriano et al., 2009, 2010). B, Although GRD (blue arrow) and Ctail (beige arrow) display MT association as isolated domains, their combined presence is required to maintain full-length Shot on MTs, since interactions of other domains might recruit Shot away (e.g., F-actin affinity; red arrow). GRD stabilizes MTs (darker patches), but can do so only when Shot is associated with MTs. C, Shot executes two functions in neurons. First, Shot stabilizes MTs via its C terminus (MAP function) requiring strong MT association (blue-brown curved arrows) but no obvious dependence on actin linkage (red arrow). Second, EB1 predominantly tracks polymerizing MT plus ends (green dotted arrows) and recruits some Shot activity to this location (black dashed arrows); this +TIP function of Shot requires F-actin linkage and is likely to guide MT polymerization events along F-actin structures, for example along the axonal cortex. D, The loss of MT association in Shot-ΔCtail, disturbs both MAP and +TIP functions and no rescue of any neuronal shot−/− mutant phenotype can be achieved (shown in Figures 1, L, M, O, Q, and 2M). E, Shot-3MtLS* can no longer interact with EB1, but can still associate with MTs; therefore, only +TIP function is abolished (leading to disorganized MTs and axonal growth defects shown in Fig. 1L, M, P, Q), whereas MAP functions are maintained reflected in the ability to stabilize MTs (Fig. 2M).

References

    1. Ahmad FJ, He Y, Myers KA, Hasaka TP, Francis F, Black MM, Baas PW. Effects of dynactin disruption and dynein depletion on axonal microtubules. Traffic. 2006;7:524–537. - PubMed
    1. Akhmanova A, Steinmetz MO. Tracking the ends: a dynamic protein network controls the fate of microtubule tips. Nat Rev Mol Cell Biol. 2008;9:309–322. - PubMed
    1. Alves-Silva J, Hahn I, Huber O, Mende M, Reissaus A, Prokop A. Prominent actin fibre arrays in Drosophila tendon cells represent architectural elements different from stress fibres. Mol Biol Cell. 2008;19:4287–4297. - PMC - PubMed
    1. Applewhite DA, Grode KD, Keller D, Zadeh AD, Slep KC, Rogers SL. The Spectraplakin Short stop is an actin-microtubule cross-linker that contributes to organization of the microtubule network. Mol Biol Cell. 2010;21:1714–1724. - PMC - PubMed
    1. Bielas SL, Serneo FF, Chechlacz M, Deerinck TJ, Perkins GA, Allen PB, Ellisman MH, Gleeson JG. Spinophilin facilitates dephosphorylation of doublecortin by PP1 to mediate microtubule bundling at the axonal wrist. Cell. 2007;129:579–591. - PMC - PubMed

Publication types

MeSH terms

LinkOut - more resources