. 2012 Jul 4;32(27):9159-72.
doi: 10.1523/JNEUROSCI.0065-12.2012.

Robustness of cortical topography across fields, laminae, anesthetic states, and neurophysiological signal types

Affiliations

Robustness of cortical topography across fields, laminae, anesthetic states, and neurophysiological signal types

Wei Guo et al. J Neurosci. .

Abstract

Topographically organized maps of the sensory receptor epithelia are regarded as cornerstones of cortical organization as well as valuable readouts of diverse biological processes ranging from evolution to neural plasticity. However, maps are most often derived from multiunit activity recorded in the thalamic input layers of anesthetized animals using near-threshold stimuli. Less distinct topography has been described by studies that deviated from the formula above, which brings into question the generality of the principle. Here, we explicitly compared the strength of tonotopic organization at various depths within core and belt regions of the auditory cortex using electrophysiological measurements ranging from single units to delta-band local field potentials (LFP) in the awake and anesthetized mouse. Unit recordings in the middle cortical layers revealed a precise tonotopic organization in core, but not belt, regions of auditory cortex that was similarly robust in awake and anesthetized conditions. In core fields, tonotopy was degraded outside the middle layers or when LFP signals were substituted for unit activity, due to an increasing proportion of recording sites with irregular tuning for pure tones. However, restricting our analysis to clearly defined receptive fields revealed an equivalent tonotopic organization in all layers of the cortical column and for LFP activity ranging from gamma to theta bands. Thus, core fields represent a transition between topographically organized simple receptive field arrangements that extend throughout all layers of the cortical column and the emergence of nontonotopic representations outside the input layers that are further elaborated in the belt fields.


Figures

Figure 1.
Figure 1.
Organization of core and belt auditory fields in the mouse cortex. A, An exemplary tessellated BF map delineated from 300 MU recording sites in the middle layers of mouse auditory cortex. Polygon size is proportional to the spacing of adjacent penetrations. Polygon color reflects BF. Black dots represent unresponsive sites. B, Example FRAs measured from the recording sites marked in A. Lighter colors represent higher spike counts. Tone-driven FRA region is enclosed by white outline. Vertical gray lines denote BF. Response quality for each site is represented by d′ value derived from comparison of tone-driven and tone-unrelated FRA regions. C, Schematized organization of the mouse auditory cortex, identifying the relative position of five auditory fields. Core fields are shaded gray. Arrows in core fields represent the low (L) to high (H) tonotopic axes. Blue-shaded region denotes core A1 and AAF described in our recent study (Hackett et al., 2011). Yellow-shaded region denotes the area previously described as the ultrasonic field (Stiebler et al., 1997). D, Relative position of auditory fields in four cases where several, but not all, fields were mapped. Ellipses represent the location of A1. L, lateral; R, rostral; A1, primary auditory cortex; AAF, anterior auditory field; DP, dorsal posterior auditory field; A2, secondary auditory cortex; IAF, insular auditory field. Scale bar, 0.5 mm.
Figure 2.
Figure 2.
Spatially organized feature representations in mouse auditory cortex. A, Tonotopic vector map of BFs. B, Distribution of individual vectors shown in A grouped according to field. Black lines indicate the average vectors. CE, Spatial organization of bandwidth, FRA tuning, and onset latency. F–H, Mean ± SEM bandwidth, FRA d′, and onset latency of each field across animals. I, Median ± interquartile range of tonotopic vector deviation for each field. Lower values indicate more uniform tonotopic gradients. Asterisks denote statistically significant differences relative to A1 (***p < 2.5 × 10⁻⁴, which is the significance level at p < 0.001 after a Bonferroni correction for 4 comparisons; unpaired t test in F–H, Wilcoxon rank sum test in I). Scale bar, 0.5 mm.
Figure 3.
Figure 3.
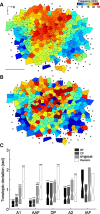
Effect of suprathreshold versus threshold sound levels on tonotopy. A–B, Vector map calculated from CF (A) and BF at 60 dB SPL (B). C, Median ± interquartile range of tonotopic deviation based on BF, CF, BF60, and randomized maps. Asterisks and plus signs indicate statistically significant difference from BF and random conditions, respectively (*/+p < 1.7 × 10⁻², **/++p < 3.3 × 10⁻³, ***/+++p < 3.3 × 10⁻⁴, which are the significance levels at p < 0.05, p < 0.01, and p < 0.001, respectively, following a Bonferroni correction for 3 comparisons; Wilcoxon rank sum test). Scale bar, 0.5 mm.
Figure 4.
Figure 4.
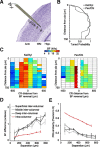
Organization of tonal receptive fields within and between cortical columns in core fields of auditory cortex. A, Schematic of columnar recordings approach. Numbers denote approximate location of cortical layers 1–6. B, Tuned FRA probability as a function of recording depth and anesthetic type. C, Representative columnar maps at 16 depths through central A1 and AAF regions (Fig. 1C, blue-shaded region) under ketamine/xylazine (left, 1 animal) and pentobarbital/chlorprothixene (right, 2 animals) anesthesia. Blank boxes indicate unresponsive or not well tuned sites. D–E, Mean ± SEM absolute value of BF difference (D) or FRA similarity (E) between pairs of well tuned (d′ > 3) recording sites as a function of their distance. Intercolumnar comparisons made at a fixed depth across penetrations were subsequently grouped according to depth (superficial, 0.05–0.25 mm; middle, 0.3–0.5 mm; and deep, 0.55–0.75 mm). Values were computed separately for A1 and AAF then averaged. Actx, auditory cortex; WM, white matter; Hipp., hippocampus; Ket/Xyl, ketamine/xylazine; Pen/Chl, pentobarbital/chlorprothixene. Scale bar, 0.25 mm.
Figure 5.
Figure 5.
Impact of irregularly tuned recording sites on tonotopic organization across cortical layers. A–C, Example FRAs and associated PSTHs from each depth and tuning category. Vertical gray lines denote BF. Frequency range, 4–64 kHz; level range, 0–60 dB SPL. D–F, Distributions of d′ values from each depth category. Vertical line denotes the cutoff point used for grouping tuned versus irregularly tuned recording sites. G–I, Scatter plots depict change in BF across the caudorostral extent of A1 based on tuned (filled circles) or irregularly tuned (open circles) recording sites. Solid and dashed straight lines are linear regression lines of tuned and irregularly tuned units, respectively.
Figure 6.
Figure 6.
Frequency tuning across neurophysiological signal types. A, Electrical activity filtered at various frequency ranges simultaneously recorded during a single trial. B–C, Representative PSTHs (B) and FRAs (C) of tone-driven activity from the same recording site used in A. Red regions indicate the analysis window used to determine their FRAs. Blue bars in A and B indicate timing of the 50 ms tone pip. Vertical gray bars denote BF of tone-driven FRA region. Frequency range, 4–64 kHz; level range, 0–60 dB SPL. D, The MU map in Figure 1A replotted according to BFs of FRAs derived from various LFP frequency ranges. Blank polygons indicate sites that are tuned according to MU but not tuned according to the LFP signals. Black dots indicate sites that are not tuned according to MU. MU, MU activity exceeding our standard threshold at 4.5 SD of the mean signal amplitude; MU7SD, MU using threshold of 7 SD; SU, single unit.
Figure 7.
Figure 7.
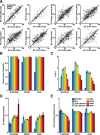
Impact of neural signal type on tonotopic organization within core fields of auditory cortex. A, Scatter plots of BF obtained from MU spiking (abscissa) versus all other signal types (ordinate) in superficial, middle, and deep layers. Diagonal line represents line of unity. B, Probability of observing a sound-evoked change in response amplitude for each signal type and layer category calculated from sites exhibiting tone-evoked MU activity. C, Quality of tuning for each signal type for each layer category. D–E, Mean ± SEM absolute BF difference (D) and FRA similarity (E) between MU and each signal type.
Figure 8.
Figure 8.
Impact of anesthetic state on tonotopic organization within core fields of auditory cortex. A–C, BF distribution along the caudorostral axis through the central region of A1 and AAF (Fig. 1C, blue-shaded regions) under ketamine/xylazine (Ket/Xyl) anesthesia (A), pentobarbital/chlorprothixene (Pen/Chi) anesthesia (B), or in the awake condition (C). Data from individual animals are represented by different colors. Black lines are linear regression lines for A1 and AAF, respectively. Data in B is replotted from Hackett et al. (2011). All regression coefficients are highly significant (p < 0.0005). D, Tonotopic BF gradients are maintained between awake and anesthetized conditions in individual animals tested in the awake and anesthetized state via chronically implanted microwire arrays. Recordings for each animal are from a single row of adjacent wires spaced 250 μm apart. E, Representative raster plots recorded from chronically implanted microwire arrays in the awake and Ket/Xyl anesthetized condition. Trials shown represent the five best frequencies at the 10 highest sound levels. F–H, Mean ± SEM bandwidth, onset latency, and response duration of A1 and AAF across awake and anesthetized conditions. Asterisks denote statistically significant differences of indicated populations (***p < 2.5 × 10⁻⁴, which is the significance level at p < 0.001 after a Bonferroni correction for 4 comparisons; unpaired t test).
Figure 9.
Figure 9.
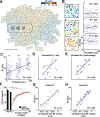
Tonotopy in simulated two-photon Ca2+ maps. A, Auditory cortex boundaries from Figure 1A populated with reported neuronal density and BF tuning from Ca2+ imaging studies (Bandyopadhyay et al., 2010; Rothschild et al., 2010). Dots represent tone-driven cells captured by two-photon imaging, and colors represent their BFs. B, Left, Higher magnification representations of heterogeneous local BF organization within three 100 × 100 μm regions identified in A. Right, Distribution of BF values in each higher magnification field along the caudorostral axis. C, BF distribution of units compiled across all three imaging fields onto a single, larger caudorostral field. Black lines represent linear fits. D, E, G, H, Distribution of simulated (D, E) and actual (G, H) SU and MU BFs from central A1 (black outlined region in A) with matching sampling densities. Different colors in G represent SU data from different animals. F, Mean ± SEM linear regression coefficients for actual MU and SU data (black bars) versus simulated data (red line) based on median BF of nearest 1–30 neighboring neurons. Asterisks indicate statistically significant difference from the MU group (*p < 1.67 × 10⁻³, which is significance level at p < 0.05 after a Bonferroni correction for 30 comparisons; unpaired t test).

Similar articles

Cited by

References

    1. Anderson LA, Christianson GB, Linden JF. Mouse auditory cortex differs from visual and somatosensory cortices in the laminar distribution of cytochrome oxidase and acetylcholinesterase. Brain Res. 2009;1252:130–142. - PubMed
    1. Atencio CA, Schreiner CE. Laminar diversity of dynamic sound processing in cat primary auditory cortex. J Neurophysiol. 2010a;103:192–205. - PMC - PubMed
    1. Atencio CA, Schreiner CE. Columnar connectivity and laminar processing in cat primary auditory cortex. PLoS One. 2010b;5:e9521. - PMC - PubMed
    1. Atencio CA, Sharpee TO, Schreiner CE. Hierarchical computation in the canonical auditory cortical circuit. Proc Natl Acad Sci U S A. 2009;106:21894–21899. - PMC - PubMed
    1. Bandyopadhyay S, Shamma SA, Kanold PO. Dichotomy of functional organization in the mouse auditory cortex. Nat Neurosci. 2010;13:361–368. - PMC - PubMed

Publication types

MeSH terms

LinkOut - more resources