. 2012 Jul 4;32(27):9205-16.
doi: 10.1523/JNEUROSCI.0924-12.2012.

Regulation of arrestin translocation by Ca2+ and myosin III in Drosophila photoreceptors

Affiliations

Regulation of arrestin translocation by Ca2+ and myosin III in Drosophila photoreceptors

Roger C Hardie et al. J Neurosci. .

Abstract

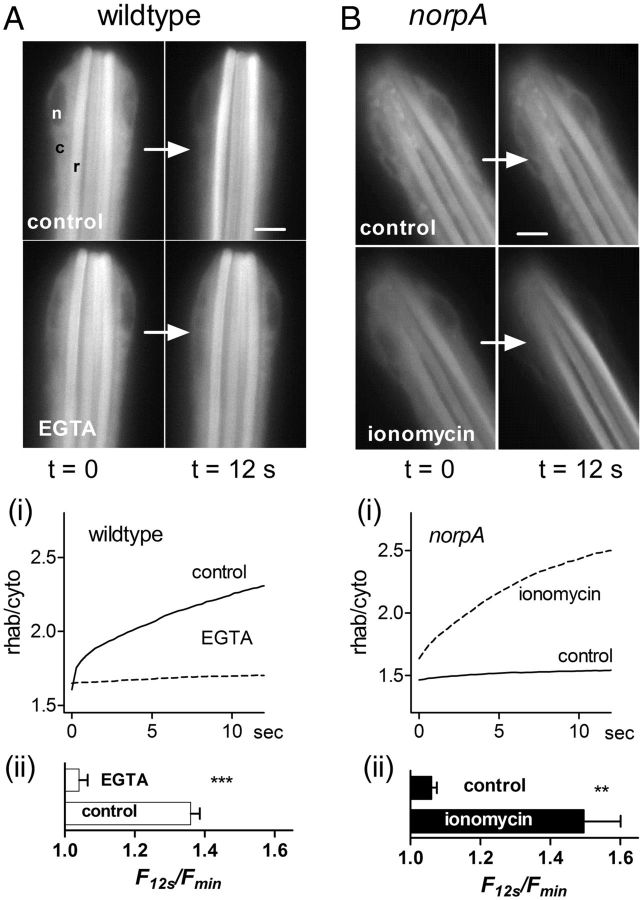
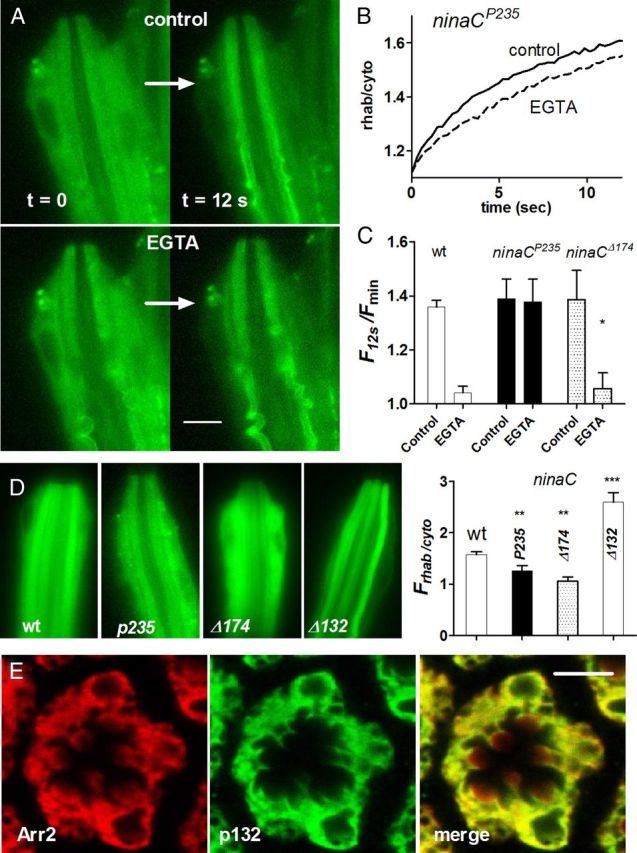
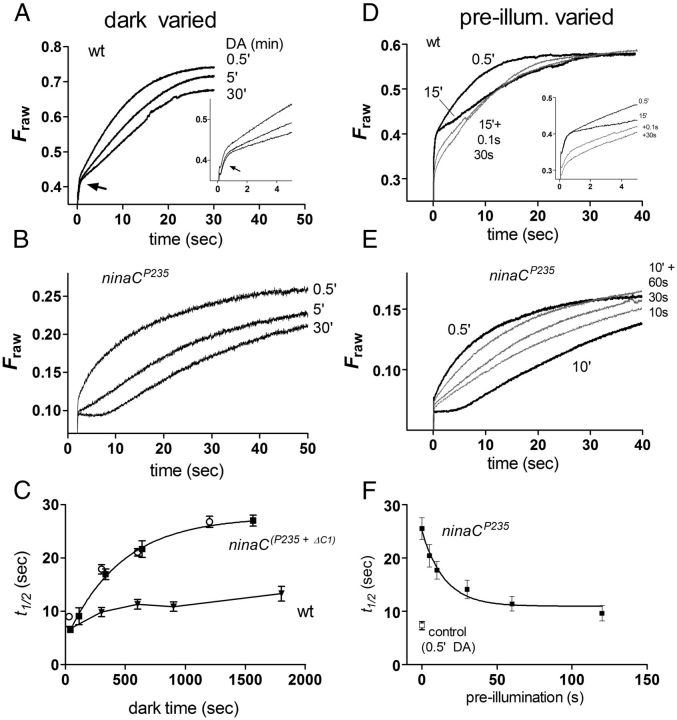
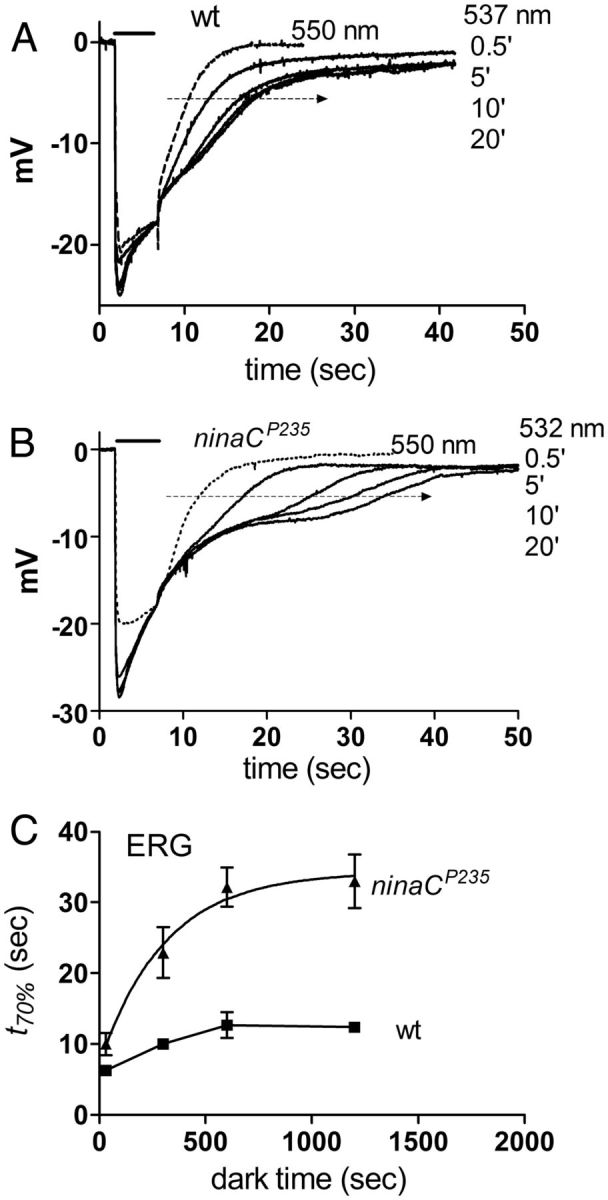
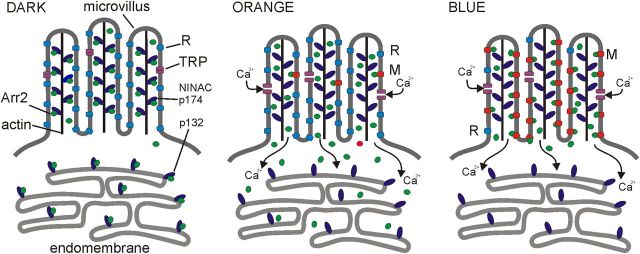
Upon illumination several phototransduction proteins translocate between cell body and photosensory compartments. In Drosophila photoreceptors arrestin (Arr2) translocates from cell body to the microvillar rhabdomere down a diffusion gradient created by binding of Arr2 to photo-isomerized metarhodopsin. Translocation is profoundly slowed in mutants of key phototransduction proteins including phospholipase C (PLC) and the Ca(2+)-permeable transient receptor potential channel (TRP), but how the phototransduction cascade accelerates Arr2 translocation is unknown. Using real-time fluorescent imaging of Arr2-green fluorescent protein translocation in dissociated ommatidia, we show that translocation is profoundly slowed in Ca(2+)-free solutions. Conversely, in a blind PLC mutant with ∼100-fold slower translocation, rapid translocation was rescued by the Ca(2+) ionophore, ionomycin. In mutants lacking NINAC (calmodulin [CaM] binding myosin III) in the cell body, translocation remained rapid even in Ca(2+)-free solutions. Immunolabeling revealed that Arr2 in the cell body colocalized with NINAC in the dark. In intact eyes, the impaired translocation found in trp mutants was rescued in ninaC;trp double mutants. Nevertheless, translocation following prolonged dark adaptation was significantly slower in ninaC mutants, than in wild type: a difference that was reflected in the slow decay of the electroretinogram. The results suggest that cytosolic NINAC is a Ca(2+)-dependent binding target for Arr2, which protects Arr2 from immobilization by a second potential sink that sequesters and releases arrestin on a much slower timescale. We propose that rapid Ca(2+)/CaM-dependent release of Arr2 from NINAC upon Ca(2+) influx accounts for the acceleration of translocation by phototransduction.


Figures

Figure 1.
Figure 1.
Arr2-GFP translocation in dissociated ommatidia is Ca2+ dependent. A, Frames from movies of Arr2-GFP fluorescence in otherwise wild-type ommatidium (125 ms exposures, sampled at 3 Hz). In the first frame (t = 0 s) fluorescence is seen in both cell body (c) and rhabdomeres (r), but not in nucleus (n). By 12 s under control conditions (above), fluorescence in the cell body had decreased and increased in the rhabdomere. In the same ommatidium perfused with Ca2+-free EGTA-buffered solution, there was little change after 12 s. Ai, Time course of fluorescence increases (ratio of average fluorescence in rhabdomere and cytosol) under the two conditions (mean from n = 6 ommatidia). Aii, Bar graph summarizing data, expressed as relative increase in the rhab/cyto ratio over 12 s (mean ± SEM n = 6). B, Similar measurements made in null norpAP24 mutant lacking PLC. In normal bath (control), there was now no obvious change in the fluorescence distribution; however, in measurements made ∼30 s after brief application of a Ca2+ ionophore (ionomycin, 14 μm dotted trace), robust translocation was observed. Bi, Bii, Summary of time course and relative increase in the rhab/cyto ratio over the 12 s measurement period as in A (n = 6). Scale bar, 5 μm. Significance levels (paired, two-tailed t test): **p < 0.005; ***p < 10−6 with respect to same cell controls.
Figure 2.
Figure 2.
ninaC mutants lacking cytosolic MyoIII do not require Ca2+ influx for rapid translocation. A, Frames from movies of Arr2-GFP fluorescence in ommatidium of ninaCP235-null mutant. In the first frame (t = 0 s) fluorescence is evenly distributed throughout the cell body and rhabdomeres, but by 12 s the rhabdomere is brighter in both control (1.5 mm Ca2+) solution (top) and in the same cell perfused with Ca2+-free, EGTA- buffered solution (bottom). B, Time courses of fluorescence increase (ratio of average fluorescence in rhabdomere and cytosol). C, Bar graph summarizing data, expressed as relative increase in the rhab/cyto ratio over 12 s. In wild-type (data from Fig. 1) and ninaCΔ174 mutants lacking just the rhabdomeric p174 isoform, translocation was suppressed in EGTA-buffered solution, but not in ninaCP235 (mean ± SEM n = 4–7 ommatidia; *p < 0.005). D, Representative images of Arr2-GFP fluorescence at t = 0 s (i.e., dark adapted) in dissociated ommatidia from wild-type ninaCp235 ninaCΔ174 (expressing only cytosolic NINAC) and ninaCΔ132 (expressing only rhabdomeric NINAC) flies. Right, Quantification showing initial dark-adapted ratio of rhabdomere to cytosol fluorescence (mean ± SEM, n = 4–14 ommatidia). All ninaC alleles were significantly increased/decreased with respect to wild-type (**p < 0.001; ***p < 10−5 unpaired, two-tailed t test). E, Transverse section of dark-adapted wild-type (w1118) ommatidium immunolabeled with Arr2 (left) and NINAC p132 antibodies (center) merged image (right). Apart from the presence of Arr2 in the rhabdomeres, there is tight colocalization (representative of n = 5 flies). Scale bar, 5 μm.
Figure 3.
Figure 3.
Rapid fluorescence increase, dependent on rhabdomeric NINAC. A, Arr2-GFP fluorescence measured in vivo from the DPP in an otherwise wild-type fly and a ninaCP235-null mutant. The wild-type (wt) trace is characterized by an early rapid phase lasting ∼0.5 s that is absent in ninaC. B, Same traces on a faster timescale, plus traces from ninaCΔ132, which retains the fast phase and ninaCΔ174, which lacks this component. Representative of n ≥ 20 (wild-type or ninaCP235) and n ≥ 6 ninaCΔ132 or ninaCΔ174 flies. Traces normalized (between Fmin at t = 0, and F after 10 s) for comparison of kinetics. C, Arr2-GFP fluorescence in a wild-type fly measured 30 s after 10s photo-equilibrating green (540 nm) illumination (G1). A second 4 s green stimulus (G2) was delivered at variable delays (DA) before the blue (B) excitation triggered translocation. When excited 0.05 s after termination of the second pulse, the fast phase was almost eliminated, but recovered rapidly (arrowheads) as the dark-adaptation period (DA) was increased to 10 s. D, Using the same protocol in ninaCP235 the second pulse made no difference (0.05 and 10 s only shown). E, Time course of the recovery of the fast phase (as in C) measured as the relative incremental increase in fluorescence averaged between 0.3 and 0.5 s (ΔF0.5/Fmin) after onset of blue excitation. Mean ± SEM n = 5, data fitted with single exponential (τ = 2.6 s).
Figure 4.
Figure 4.
Evidence for an alternative cytosolic sink in ninaC mutants. A–C, Effect of dark adaptation (DA). A, Arr2-GFP translocation measured from the DPP in a control fly (expressing Arr2-GFP on arr2 mutant background), after 30 s, 5 min, and 30 min in the dark following photo-equilibrating orange illumination. Although the rapid phase (arrow) was unaffected, translocation was slower after prolonged dark adaptation. Inset, Shows detail of first 5 s. B, Similar protocol in ninaCP235-null mutant. The fast phase was absent, but the slowing of translocation with dark adaptation was more pronounced. C, t1/2 of translocation as a function of dark adaptation time in ninaC mutant (ninaCP235, solid symbols; ninaCΔC1, open symbols) and wild-type backgrounds. Mean ± SEM (n = 5–6 flies). ninaCP235 data fitted with a single exponential (τ = 7.6 min). D–F, Effect of pre-illumination. D, Translocation time course of Arr2-GFP in wild-type background measured (from DPP) after 0.5 and 15 min DA (solid traces) and after 15 min DA, but with either 0.1 or 30 s orange pre-illumination immediately (∼2 s) before measurement (gray traces). As in A, translocation was slowed following 15′ DA; orange pre-illumination resulted in a reduced initial fluorescence signal, whereafter translocation was initially faster, finally approximately overlapping the 15 min DA “control” trace. Pre-illumination with even 0.1 s orange light was sufficient to achieve most of the effect (representative of n = 5). Inset, Shows first 5 s. E, Similar protocol in ninaCP235: translocation was even slower, now after only 10 min DA. Orange pre-illumination after 10 min DA accelerates translocation, but at least 60 s were required to accelerate translocation to rates seen after only 0.5 min DA. F, t1/2 of Arr2-GFP translocation in 10 min dark-adapted ninaCP235 flies as a function of the duration of orange pre-illumination delivered immediately before measuring translocation (mean ± SEM n = 4). Data fitted with single exponential (14.9 s). Open symbol: control, t1/2 for translocation measured after only 0.5 min DA in the same flies.
Figure 5.
Figure 5.
Electrophysiological correlates of slowed translocation. A, ERG recording from wild-type (w1118) in response to 5 s photo-equilibrating 537 nm monochromatic light (bar) after varying times in the dark. A response to 550 nm (dotted trace), which elicited no translocation is also shown. There was a significant slowing of the decay as dark-adaptation time (in each case following photo-equilibrating orange illumination) was increased from 0.5 to 20 min. B, Similar protocol in a ninaCP235-null mutant. The decay of the ERG was now more obviously prolonged with increasing dark adaptation. The wavelength was adjusted individually for each fly (in this case 532 nm) such that the ERG decay was limited by translocation time course (see text and Satoh et al., 2010, for further details). C, Decay time of the ERG (t70%: measured from the end of the 5 s light pulse to 70% decay—i.e., the level indicated by arrows in A and B) as a function of dark adaptation time in wild-type (wt) and ninaCP235 flies (mean ± SEM n = 4–5). ninaC data are fitted with a single exponential (τ = 4.5 min). The slowing of the response with increasing dark time closely reflects the effect of dark adaptation on the translocation time course (compare Fig. 4C).
Figure 6.
Figure 6.
Arr2 translocation driven by NINAC asymmetry. Arr2-GFP fluorescence in rhabdomeres measured from DPP with 1 s blue (B) excitation. Before excitation the eye was stimulated with two 4 s pulses of photo-equilibrating orange (O) illumination delivered either together but allowing 30 s dark adaptation before the blue (B) test excitation (30 s DA) or separated by 30 s, with the second pulse terminating only 1 s before the blue excitation (1 s DA). A, In wild-type controls, expressing both rhabdomeric and cytosolic forms of NINAC, there was a slight decrease in Arr2-GFP fluorescence (movement out of rhabdomere) when the orange light was delivered only 1 s before measurement (two repeated traces for each condition). B, In contrast, in ninaCΔ174 flies lacking rhabdomeric NINAC but with p132 in the cell body there was a significant increase in Arr2-GFP fluorescence in the rhabdomere (note also absence of the rapid phase). C, In ninaCΔ132 flies expressing rhabdomeric NINAC, but none in the cell body, the same stimulus resulted in a large movement of Arr2-GFP out of the rhabdomere. D, Bar graph summarizing data expressed as relative fluorescence increase (movement into rhabdomere) or decrease (movement out of rhabdomere into cell body) in measurements made when the second orange flash was delivered 1 s before measurement compared with measurement made with 30 s DA. Data normalized with respect to total range of translocation (FmaxFmin), where Fmin is the fluorescence at time 0 for whichever condition gave the lower fluorescence and Fmax determined after 60 s full translocation (data not shown).
Figure 7.
Figure 7.
Translocation in ninaC;trp and norpA;ninaC double mutants. A, Arr2-GFP fluorescence increase measured from DPP in an otherwise wild-type fly and a trp343-null mutant. As previously reported, translocation in trp mutants “stalls” after a few seconds and then progresses very slowly. A fast phase is, however, still apparent. B, In contrast, Arr2-GFP translocation in ninaCP235;trp343 double mutant is rescued and similar to ninaC single mutant control (n = 4). C, ERG responses to the 10s bright yellow illumination (same intensity) in trp, ninaCP235;trp, and ninaCP235 (representative of n ≥ 3 flies). D, Arr2-GFP translocation in norpAP24;ninaCP235 double mutants (two examples) and norpAP24 control (dotted trace). In both cases translocation was extremely slow compared with wild type. E, As previously reported, rapid translocation in a norpAP24 control (actually norpA;ninaC/+) was rescued by anoxia induced by streaming argon over the fly; but largely suppressed in the first measurement 30 s after return to air. F, In contrast, in norpAP24;ninaCP235 double mutants, near normal translocation was still observed 3 min after return to air, finally stalling after 7 min. G, Time course of suppression of Arr2-GFP translocation on return to air after rescue by argon in norpAP24;ninaCP235 and norpA controls (norpAP24;ninaCP235/+ heterozygotes from same vials). Fnorm is the fluorescence increase after 40 s blue excitation (as in E and F) normalized to maximum increase seen under argon (Mean ± SEM n = 3–5).
Figure 8.
Figure 8.
Normal Arr2 translocation in rac2 Δ mutants. A, Arr2-GFP translocation measured from DPP of wild-type and rac2Δ mutant. Both fast (putatively representing dissociation of Arr2 from NINAC) and slow (translocation) phases were similar. B, Bar graphs showing time constant (tau) of translocation, time constant of rapid phase, and extent of translocation (Fmax/Fmin) in rac2Δ (mean ± SEM n = 4) and wild-type controls (n = 11–12). No significant difference was observed in any of these parameters (t test p > 0.5). C, Translocation as a function of wavelength in rac2Δ mutants (mean ± SEM n = 2); each point represents Arr2-GFP fluorescence measured immediately (<100 ms) after onset of blue excitation following photo-equilibration to a different wavelength of monochromatic light, normalized to Fmax (Satoh et al., 2010). Dotted line wild-type data replotted from Satoh et al. (2010). D, Ommatidia labeled with a-Arr2 antibody in flies fixed in dark under infrared illumination (left) and after 3 min in the dark following 2 min exposure to bright blue light (right) in wild-type (top) and rac2Δ mutants (bottom). Both show similar translocation to rhabdomeres (representative of n = 3 dark and 4 blue-adapted rac2Δ flies; and 4–7 wild type). Scale bar, 5 μm.
Figure 9.
Figure 9.
Multisink model for Ca2+-dependent Arr2 translocation. Left, In the dark-adapted state the visual pigment is in the rhodopsin state (R; blue) with negligible affinity for Arr2 (green). Most Arr2 is bound to either the cytosolic (p132) or microvillar (p174) isoform of NINAC, a CaM binding myosin III. NINACp174 is attached to a central actin filament found in each microvillus (Hicks et al., 1996). In the cell body, Arr2 and NINAC p132 are shown associated with endomembrane, because cytosolic Arr2 was previously reported to colocalize with an endomembrane marker (Satoh et al., 2010), but this is not critical for the model. In ninaCP235-null mutants, Arr2 becomes bound or sequestered to an alternative cytosolic site with slow kinetics (not shown). The identity of this site is unknown: one candidate may be a negatively charged phosphoinositide species on the endomembrane. By analogy with vertebrate rods, microtubules are another candidate. Center, Bright long wavelength (orange) illumination leads to activation of the light-sensitive TRP channels, resulting in massive Ca2+ influx, which rapidly (<1 s) releases Arr2 from both p174 and p132: any M (red) formed is rapidly inactivated by high-affinity binding to Arr2, which is now freely diffusible. In wild-type photoreceptors orange light induces minimal translocation of Arr2 because only a tiny fraction (∼1–2%) of the visual pigment is photo-isomerized to M. However, in mutants lacking p132 or p174, the asymmetry in NINAC distribution results in translocation of Arr2 from rhabdomere to cell body or vice versa in response to orange light (Fig. 6). Right, Bright blue illumination again activates Ca2+ influx, thereby releasing Arr2 from NINAC; however, now the majority (∼70%) of visual pigment is converted to M, which acts as a high-affinity sink driving translocation to the rhabdomere (Satoh et al., 2010).

Similar articles

Cited by

References

    1. Alloway PG, Dolph PJ. A role for the light-dependent phosphorylation of visual arrestin. Proc Natl Acad Sci U S A. 1999;96:6072–6077. - PMC - PubMed
    1. Alloway PG, Howard L, Dolph PJ. The formation of stable rhodopsin-arrestin complexes induces apoptosis and photoreceptor cell degeneration. Neuron. 2000;28:129–138. - PubMed
    1. Belusic G, Pirih P, Stavenga DG. Photoreceptor responses of fruitflies with normal and reduced arrestin content studied by simultaneous measurements of visual pigment fluorescence and ERG. J Comp Physiol A Neuroethol Sens Neural Behav Physiol. 2010;196:23–35. - PMC - PubMed
    1. Bloomquist BT, Shortridge RD, Schneuwly S, Perdew M, Montell C, Steller H, Rubin G, Pak WL. Isolation of putative phospholipase C gene of Drosophila, norpA and its role in phototransduction. Cell. 1988;54:723–733. - PubMed
    1. Broekhuyse RM, Tolhuizen EF, Janssen AP, Winkens HJ. Light induced shift and binding of S-antigen in retinal rods. Curr Eye Res. 1985;4:613–618. - PubMed

Publication types

MeSH terms

LinkOut - more resources