. 2012 Jul 4;32(27):9288-300.
doi: 10.1523/JNEUROSCI.5976-11.2012.

A stochastic signaling network mediates the probabilistic induction of cerebellar long-term depression

Affiliations

A stochastic signaling network mediates the probabilistic induction of cerebellar long-term depression

Gabriela Antunes et al. J Neurosci. .

Abstract

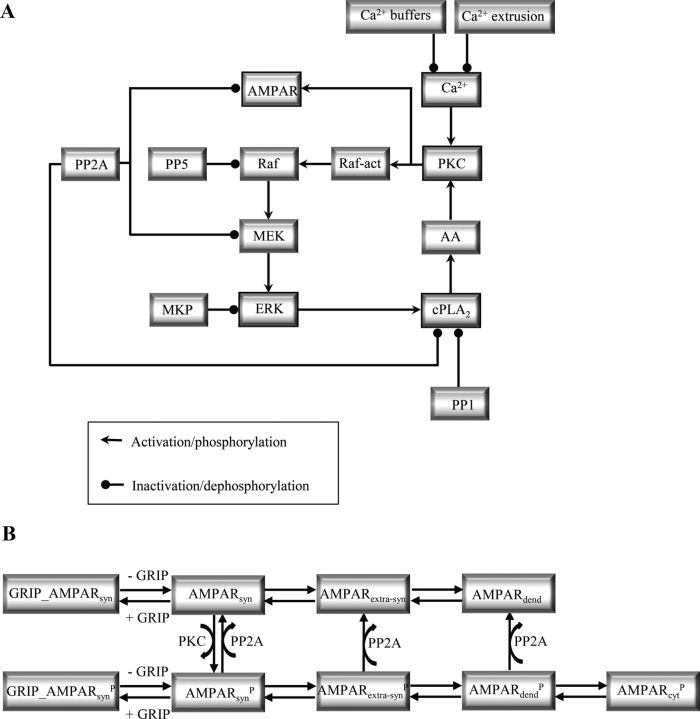
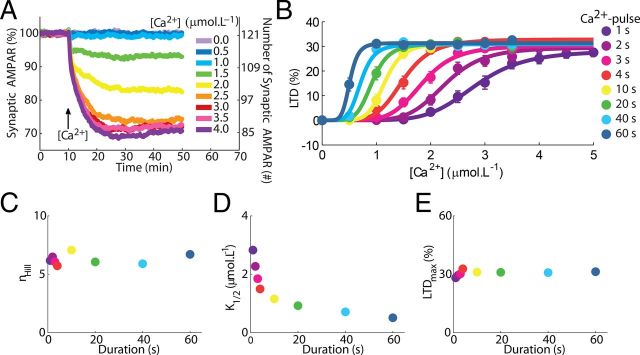
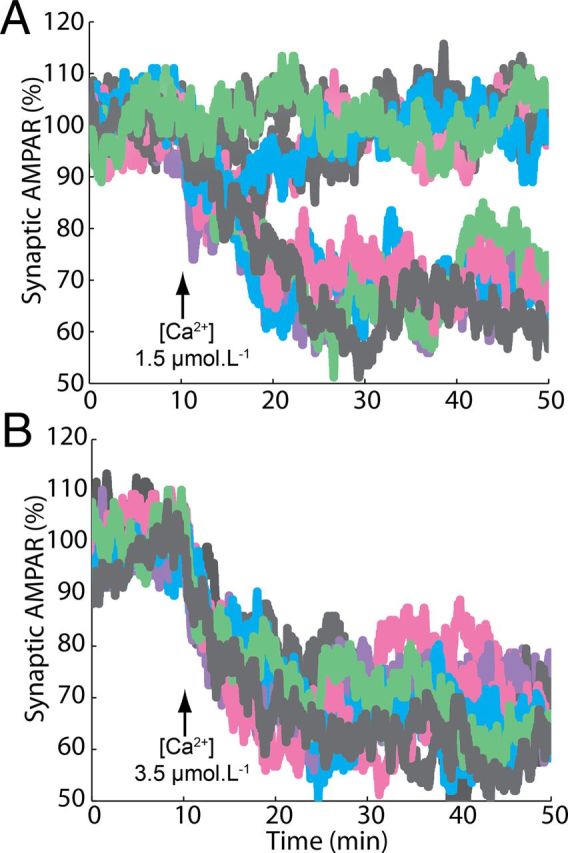
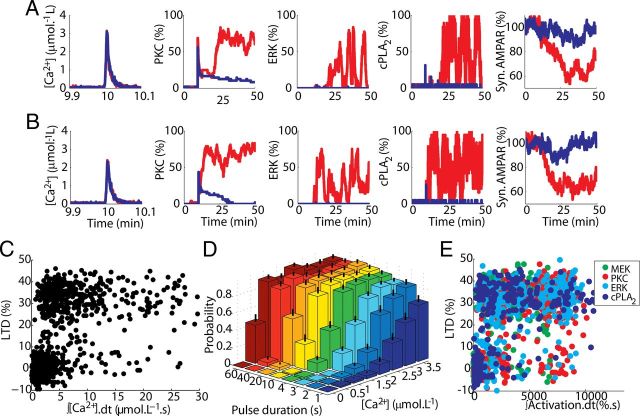
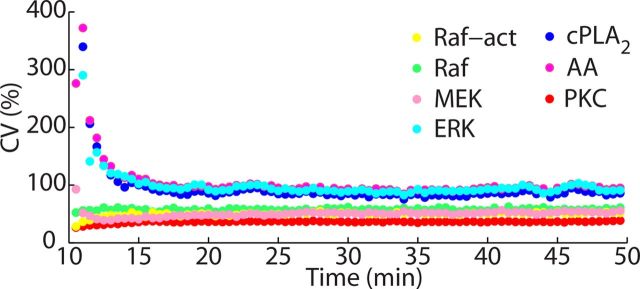
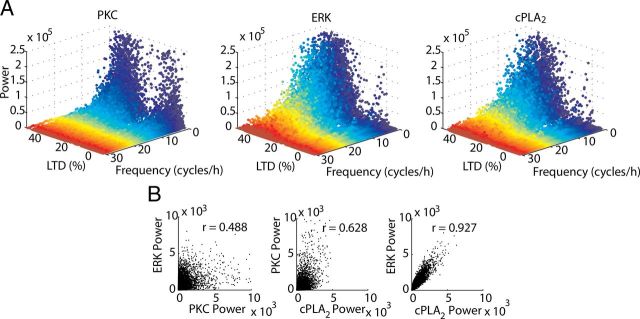
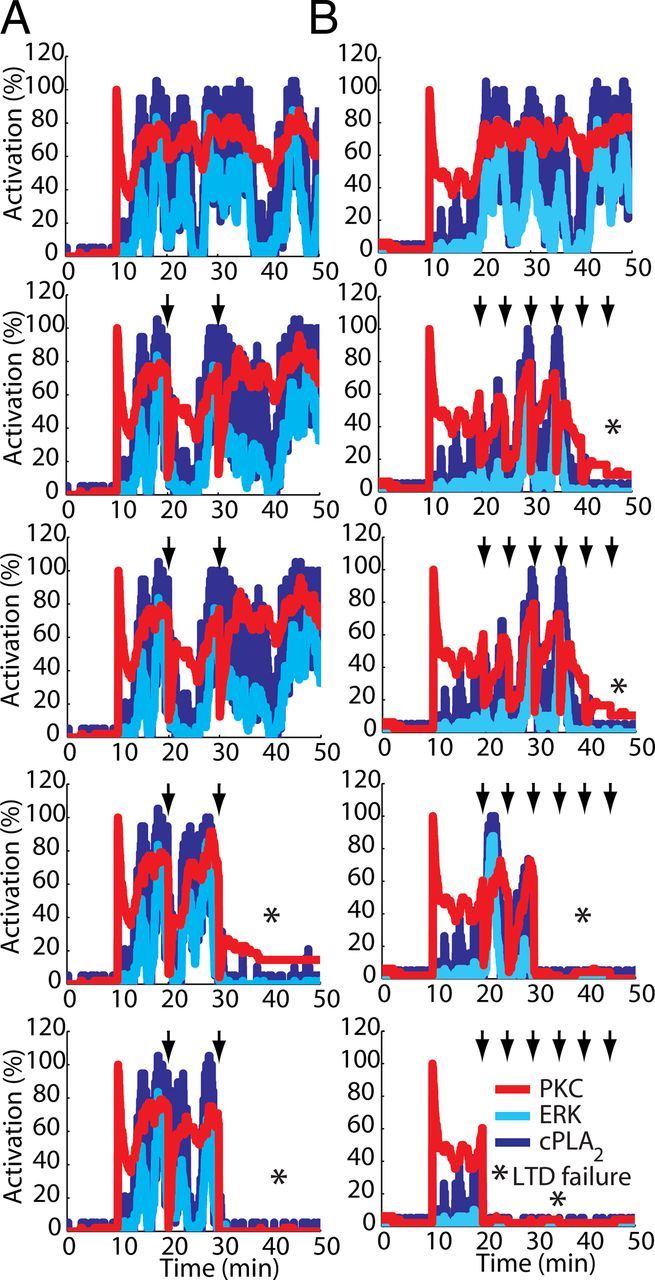
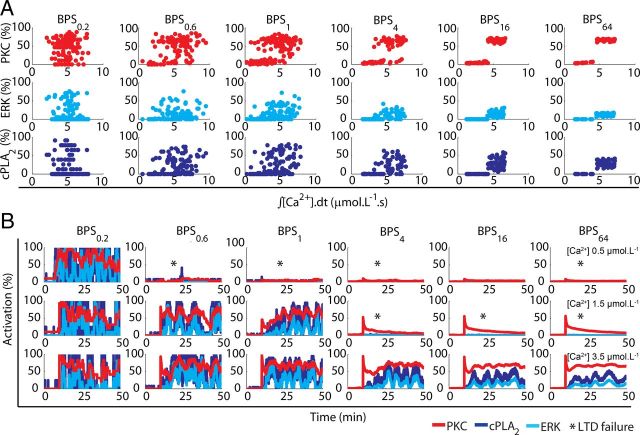
Many cellular processes involve a small number of molecules and undergo stochastic fluctuations in their levels of activity. Cerebellar long-term depression (LTD) is a form of synaptic plasticity expressed as a reduction in the number of synaptic AMPA receptors (AMPARs) in Purkinje cells. We developed a stochastic model of the LTD signaling network, including a PKC-ERK-cPLA(2) positive feedback loop and mechanisms of AMPAR trafficking, and tuned the model to replicate calcium uncaging experiments. The signaling network activity in single synapses switches between two discrete stable states (LTD and non-LTD) in a probabilistic manner. The stochasticity of the signaling network causes threshold dithering and allows at the macroscopic level for many different and stable mean magnitudes of depression. The probability of LTD occurrence in a single spine is only modulated by the concentration and duration of the signal used to trigger it, and inputs with the same magnitude can give rise to two different responses; there is no threshold for the input signal. The stochasticity is intrinsic to the signaling network and not mostly dependent on noise in the calcium input signal, as has been suggested previously. The activities of the ultrasensitive ERK and of cPLA(2) undergo strong stochastic fluctuations. Conversely, PKC, which acts as a noise filter, is more constantly activated. Systematic variation of the biochemical population size demonstrates that threshold dithering and the absence of spontaneous LTD depend critically on the number of molecules in a spine, indicating constraints on spine size in Purkinje cells.


Figures

Figure 1.
Figure 1.
Diagram of the signaling network involved in Ca2+-induced LTD and mechanisms of AMPAR trafficking. A, Transient elevations of [Ca2+] activate the positive feedback loop formed by PKC, ERK pathway, and cPLA2. PKC is responsible for the phosphorylation of AMPARs leading to the synaptic depression. PP2A counteracts this process by dephosphorylating the AMPARs. PKC also activates the ERK pathway that then activates cPLA2 that produces the PKC activator AA. B, Mechanisms of AMPAR trafficking simulated. The terms AMPARsyn, AMPARextra-syn, AMPARdend, AMPARcyt refer, respectively, to synaptic, extra-synaptic in the spine, dendritic and cytosolic AMPAR, and P refers to the phosphorylated forms of AMPAR in different locations.
Figure 2.
Figure 2.
Mean responses of the model and sigmoidal relationships between LTD and the peak concentration of the Ca2+ pulses used to trigger it. A, Time course of the depression induced by Ca2+ pulses with different concentrations. Each curve shows the mean time course obtained for 156 runs of the model (Ca2+ pulses of 3 s of duration, legend at right indicate the maximum concentration of the pulses). The magnitude of the depression observed, measured as percentage of synaptic AMPARs removed from the synaptic membrane, matches experimentally observed values (Tanaka et al., 2007), and, at rest, the model reproduces the number of AMPARs in accordance with values observed in a single synapse in PCs (Momiyama et al., 2003; Masugi-Tokita et al., 2007). Additionally, the reduction in the number of synaptic AMPARs has a time course in accordance with experimental data, reaching stable state ∼20 min after LTD induction (Tanaka and Augustine, 2008). B, The [Ca2+] requirement observed for LTD induction is regulated by the duration of the Ca2+ pulses. Each dot (legend on right side applies to BE) represents the mean result of 156 simulations measured 30 min after the input, and the error bars indicate SEM. The sigmoid curves were obtained by nonlinear least square regression to Equation 1. C, The duration of the Ca2+ pulses has no effect on the nHill observed during LTD. D, The Ca2+ requirement (K1/2) during LTD induction depends on the pulse duration. E, The maximum depression (LTDmax) is independent of pulse durations.
Figure 3.
Figure 3.
Bistable induction of LTD. A, B, Single run results of the model demonstrate that LTD in a single synapse is an all-or-none process. LTD was induced by pulses of 4 s and maximum [Ca2+] of 1.5 (A) and 3.5 μmol.L−1 (B).
Figure 4.
Figure 4.
Probabilistic induction of LTD implies the absence of clear thresholds. A, B, Comparison between activation of network components and LTD induction between two different pairs of single runs of the model stimulated by Ca2+ pulses with same peak concentration (high in A and low in B) and duration. These runs were selected to have similar noisy fluctuations of the Ca2+ pulse but opposite responses of the model: successful LTD induction (red) or failure (blue). C, There is no threshold for the Ca2+ pulse: single runs of the model demonstrate a large overlap of opposite responses (LTD and non-LTD) triggered by similar Ca2+ input signals integrated over time (pulses of 1–60 s, and 0.5–3.5 μmol.L−1). D, The probability of LTD induction (computed from 156 simulations, mean and SD shown) is regulated by the duration and concentration of the input signal. E, LTD can also be induced by a pulse of activated component of the feedback loop (Tanaka and Augustine, 2008). Similarly to the results obtained for Ca2+-induced LTD, single run results of LTD induced by pulses of different activated components of the feedback loop (PKC, ERK, cPLA2, and MEK indicated by colors) show a large overlap of opposite responses caused by a wide range of inputs signals (pulses varying from 10 to 120 s of duration, and peak value varying from 1 to 100% of activation) integrated over time. This indicates that threshold dithering is spread throughout the signaling network.
Figure 5.
Figure 5.
Propagation of noise within the network over time. The CV, a common measure of noise, of different components of the network shows that the level of stochasticity of the network has limited propagation. ERK greatly increases the stochasticity of the network, and, in consequence, acts as important locus of variability in the model. Molecules downstream from ERK, cPLA2, and AA act in a similar way. In contrast, PKC is a locus of filtering, decreasing the stochasticity of the network.
Figure 6.
Figure 6.
Discrete activity-dependent changes of NFs in the signaling network during LTD. A, LTD occurrence (LTD > 10%) promotes a small shift in the power of NFs of PKC and large shifts for the powers of NFs of ERK and cPLA2, calculated for single runs of the model. B, Correlation between the powers of stochastic fluctuations is strong only between ERK and cPLA2. In all panels, LTD was induced by Ca2+ pulses of 1–60 s and 0.5–3.5 μmol.L−1.
Figure 7.
Figure 7.
Detrimental effects of large fluctuations of PKC activity during LTD occurrence. Fluctuations in PKC activation are detrimental for the activation of the signaling network if they happen with high peak-to-peak amplitude fluctuations or with high frequency. Single runs of the model using equal seeds to initiate the simulations illustrate this detrimental effect. Each column (A, B) shows the results of simulations using the same seed. In these examples, a Ca2+ pulse of 4 s and peak concentration of 3.5 μmol.L−1 applied at 10 min was used to induce the activation of the signaling network, and two (A) or six (B) transient perturbations (indicated by arrows) reducing PKC activity to a level varying from 80% to 0% of its activation (top to bottom) were applied. Each perturbation had a duration of 3 s. Both larger amplitude and high-frequency fluctuations in PKC activity negatively interfere with the activation of the signaling network, leading to failure of LTD (indicated by asterisks in the panel).
Figure 8.
Figure 8.
The role of stochastic fluctuations investigated through alterations in the BPS. A, The percentage activation of the three network components investigated is plotted against Ca2+ input signal integrated over time for different BPS. For the standard model (BPS1), no thresholds are visible to Ca2+ pulses of 4 s and 0.5–3.5 μmol.L−1. Enlarging the BPS of the standard model (BPS1) from 4 (BPS4) to 64 times (BPS64) decreases the overlap of responses and a fixed threshold emerges gradually. Reducing BPS1 to 60% (BPS0.6) and 20% (BPS0.2) has the opposite effect. B, Altering the BPS changes the magnitude and frequency of stochastic fluctuations during single runs of the model, modifying the probability of activation of the network for different inputs [Ca2+ pulses of 4 s and 0.5 (top), 1.5 (middle) and 3.5 μmol.L−1 (bottom)]. For small BPS, LTD induction is always successful, while for large BPS the number of failures (shown by asterisks) at low Ca2+ pulses increases and the intensity of stochastic fluctuations during successful induction decreases.
Figure 9.
Figure 9.
Dependence of the macroscopic LTD responses on BPS. A, Macroscopic curves of LTD (means of 156 runs, Ca2+ pulses of 4 s applied at 10 min) showing the reduction in the variability and stability of responses when BPS is altered. Lowering BPS leads to a monostable system with spontaneous LTD while increasing it leads to a bistable system, similar to deterministic versions of the model (E). Stable intermediary mean levels of LTD, similar to those observed experimentally, are present only between BPS0.6 to BPS4. B, Sigmoidal relationship between the macroscopic LTD and peak [Ca2+] (pulses of 4 s) obtained using different BPSs. Data from 156 runs are plotted as mean ± SEM. Inset shows the responses of BPS0.2 that could not be fitted with a sigmoid. C, D, nHill and K1/2 for different BPSs. E, The same model was solved deterministically (using the Runge–Kutta method). In the absence of stochasticity the model shows a bistable behavior (see A for legend).

References

    1. Adams DG, Coffee RL, Jr, Zhang H, Pelech S, Strack S, Wadzinski BE. Positive regulation of Raf1-MEK1/2-ERK1/2 signaling by protein serine/threonine phosphatase 2A holoenzymes. J Biol Chem. 2005;280:42644–42654. - PubMed
    1. Adams JP, Sweatt JD. Molecular psychology: roles for the ERK MAP kinase cascade in memory. Annu Rev Pharmacol Toxicol. 2002;42:135–163. - PubMed
    1. Adesnik H, Nicoll RA, England PM. Photoinactivation of native AMPA receptors reveals their real-time trafficking. Neuron. 2005;48:977–985. - PubMed
    1. Arkin A, Ross J, McAdams HH. Stochastic kinetic analysis of developmental pathway bifurcation in phage lambda-infected Escherichia coli cells. Genetics. 1998;149:1633–1648. - PMC - PubMed
    1. Ashby MC, De La Rue SA, Ralph GS, Uney J, Collingridge GL, Henley JM. Removal of AMPA receptors (AMPARs) from synapses is preceded by transient endocytosis of extrasynaptic AMPARs. J Neurosci. 2004;24:5172–5176. - PMC - PubMed

MeSH terms

LinkOut - more resources