. 2012 Jul 4;32(27):9383-95.
doi: 10.1523/JNEUROSCI.6363-11.2012.

TRPC5 channel is the mediator of neurotrophin-3 in regulating dendritic growth via CaMKIIα in rat hippocampal neurons

Affiliations

TRPC5 channel is the mediator of neurotrophin-3 in regulating dendritic growth via CaMKIIα in rat hippocampal neurons

Zhuohao He et al. J Neurosci. .

Abstract

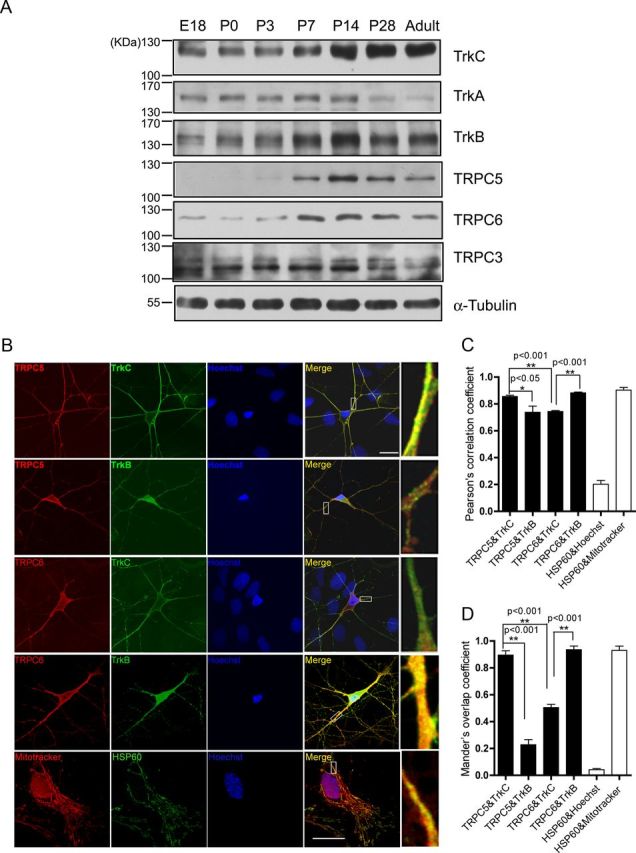
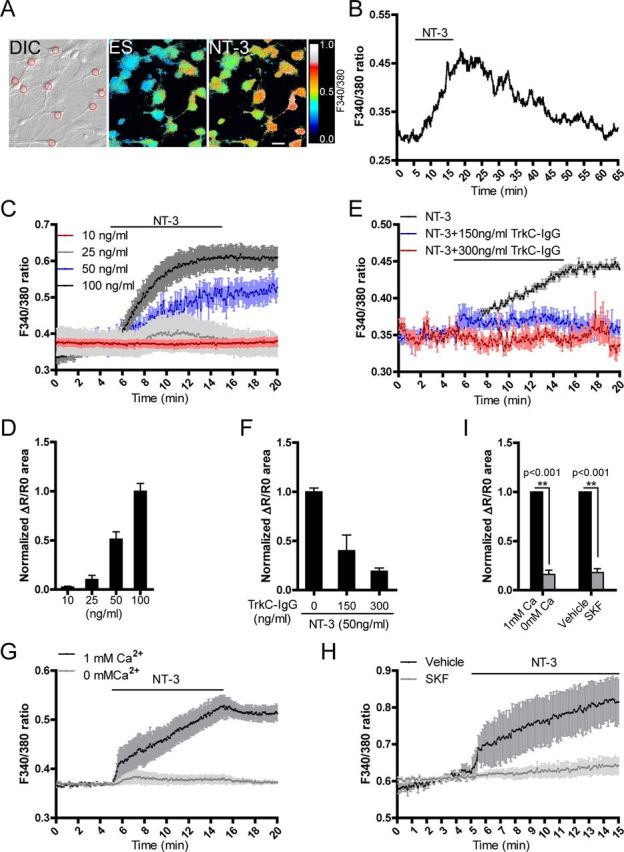
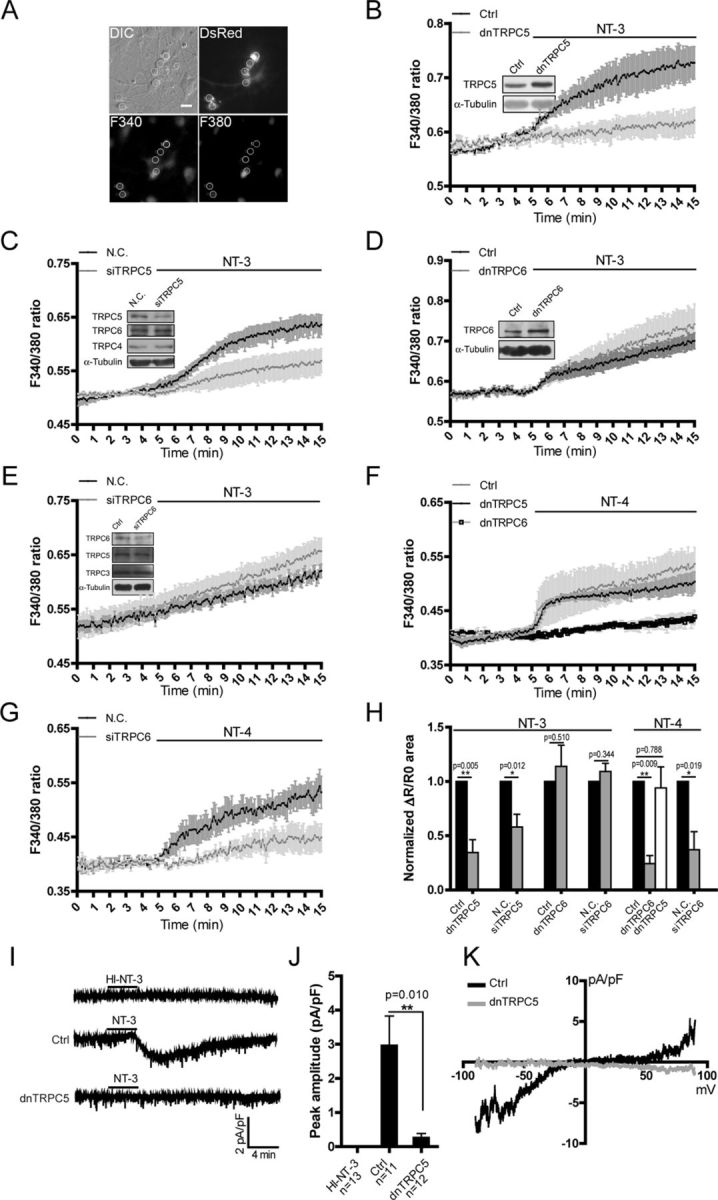
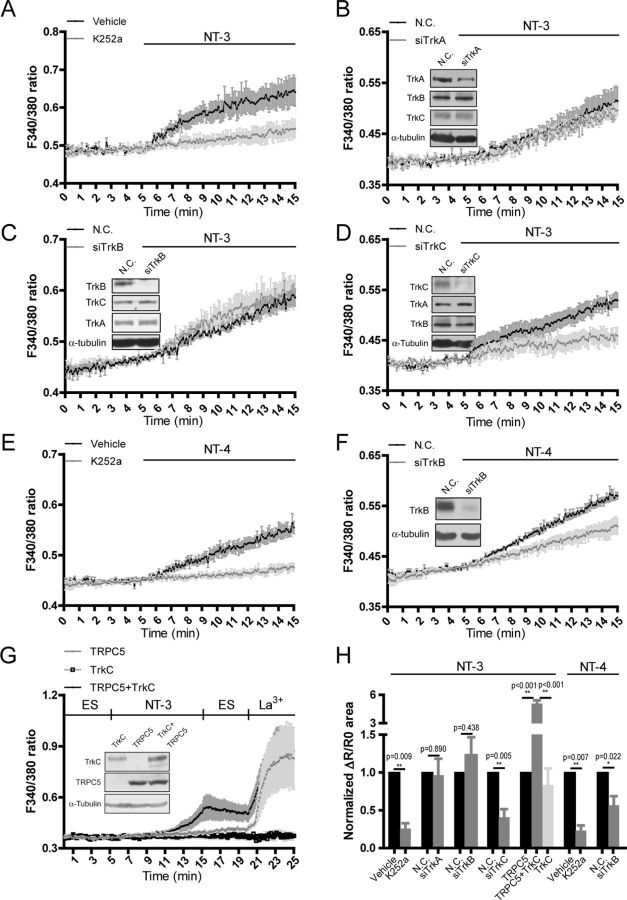
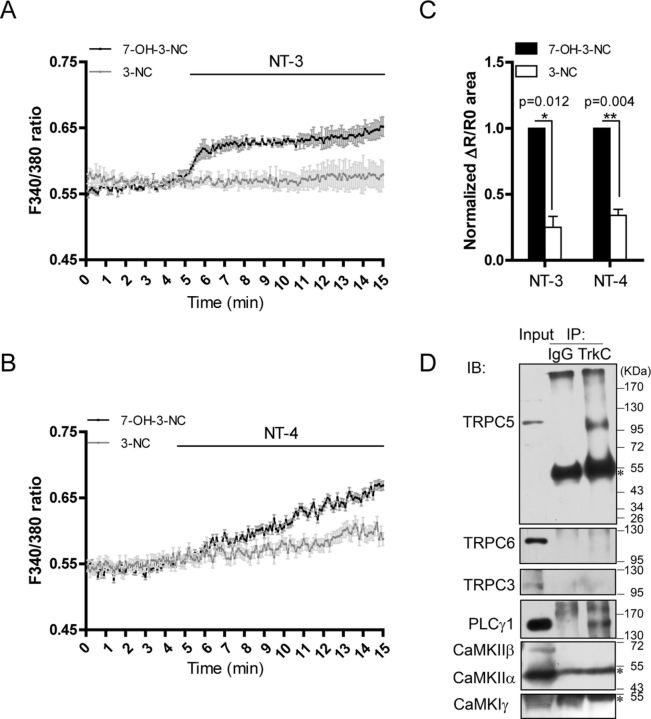
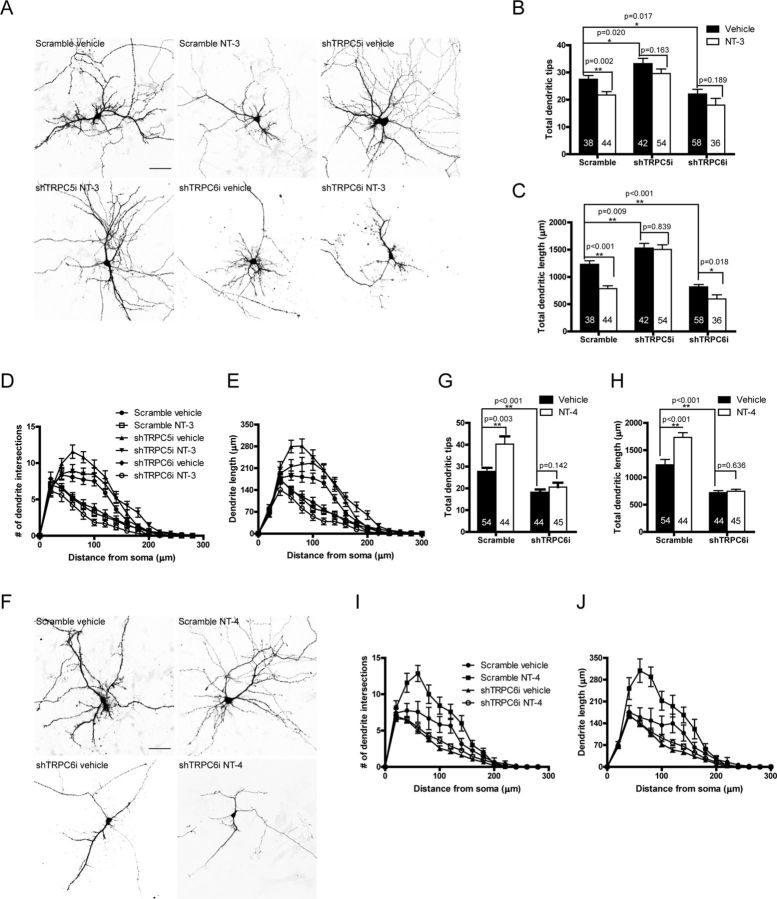
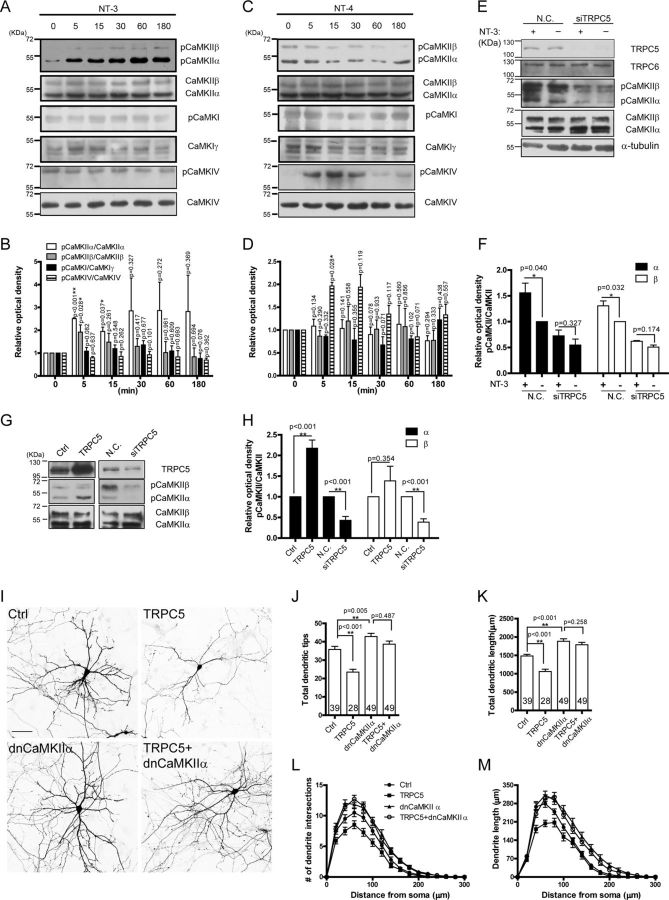
Neurotrophin-3 (NT-3) plays numerous important roles in the CNS and the elevation of intracellular Ca(2+) ([Ca(2+)](i)) is critical for these functions of NT-3. However, the mechanism by which NT-3 induces [Ca(2+)](i) elevation remains largely unknown. Here, we found that transient receptor potential canonical (TRPC) 5 protein and TrkC, the NT-3 receptor, exhibited a similar temporal expression in rat hippocampus and cellular colocalization in hippocampal neurons. Stimulation of the neurons by NT-3 induced a nonselective cation conductance and PLCγ-dependent [Ca(2+)](i) elevation, which were both blocked when TRPC5, but not TRPC6 channels, were inhibited. Moreover, the Ca(2+) influx through TRPC5 induced by NT-3 inhibited the neuronal dendritic growth through activation of calmodulin-dependent kinase (CaMK) IIα. In contrast, the Ca(2+) influx through TRPC6 induced by NT-4 promoted the dendritic growth. Thus, TRPC5 acts as a novel and specific mediator for NT-3 to regulate dendrite development through CaMKIIα.


Figures

Figure 1.
Figure 1.
The expression of Trks and TRPCs in rat hippocampus. A, Western blots of total lysates extracted from rat hippocampus at different developmental stages with indicated antibodies. α-Tubulin served as a loading control. B, Representative staining of cultured hippocampal neurons at 7 DIV with the indicated antibodies or dyes. Right, Ninefold magnification of the white rectangle areas in “Merge.” Bottom, Representative staining of culture astrocytes at 7 DIV labeled with Mitotracker anti-HSP60 for mitochondria and Hoechst33342 for nucleus. Scale bar: 20 μm. C, D, Quantification of the colocalization of TRPCs and Trks shown in B. Lower limit: HSP60 and Hoechst33342, PCC, 0.202 ± 0.028; MOC, 0.042 ± 0.008. Upper limit: HSP60 and Mitotracker, PCC, 0.903 ± 0.020; MOC, 0.931 ± 0.032. In each group, 4–11 pictures were analyzed, *p < 0.05; **p < 0.01.
Figure 2.
Figure 2.
NT-3 induced [Ca2+]i elevation in cultured hippocampal neurons. A, An example of Fura-2-AM-loaded hippocampal neurons. Red circle in “DIC” panel indicates the regions from where the 340/380 ratios were obtained. The pseudocolor panels show the 340/380 ratio changes of the cells before and after applying NT-3. DIC, differential interference contrast; ES, extracellular solution. Scale bar: 20 μm. B, A representative trace showing the F340/380 ratio values of neurons in response to NT-3. Delay time was the period from applying NT-3 to the initial Ca2+ rising. Rise time was the period from the initial Ca2+ rising to the peak level. C, Dose-effect of NT-3 on [Ca2+]i elevation. D, Quantification of C. E, Effective concentration of NT-3 needed to evoke Ca2+ signals. F, Quantification of E. G, H, Effects of extracellular Ca2+ (G) or SKF96365 (10 μm) (H) on NT-3-induced [Ca2+]i changes. I, Statistics of the normalized area of ΔR/R0 curve in G and H. Cultured hippocampal neurons were measured at 7–9 DIV. NT-3, 50 ng/ml unless otherwise specified. Data were presented as means ± SEM from at least three independent experiments with >60 cells in each group.
Figure 3.
Figure 3.
TRPC5 mediated the NT-3-induced [Ca2+]i elevation in cultured hippocampal neurons. A, An example showing how the transfected neurons with red fluorescence were identified and measured. Scale bar: 20 μm. B–E, NT-3-induced [Ca2+]i elevation in the neurons transfected with (B) the control vector or dnTRPC5; (C) N.C. or siTRPC5; (D) control vector or dnTRPC6; (E) N.C. or siTRPC6. Insets, representative immunoblots showing the effect of gene manipulation in the measured neurons. F, G, NT-4-induced [Ca2+]i elevation in the neurons transfected with (F) control vector (gray dot), dnTRPC5 (black dot), or dnTRPC6 (open squares); (G) N.C. or siTRPC6. H, Statistics of the normalized area of ΔR/R0 curve from B to G. *p < 0.05; **p < 0.01. I, Representative whole-cell recording traces with active or heat-inactivated NT-3 (HI-NT-3) in the neurons transfected with control vector (n = 11) or dnTRPC5 (n = 12). Control (Ctrl), 2.973 ± 0.854 pA/pF; dnTRPC5, 0.269 ± 0.116 pA/pF. NT-3, 100 ng/ml. J, Statistic results of the peak amplitude of the current shown in I. K, Representative current–voltage curves of the currents shown in I. A ramp potential holding from −90 to +90 mV was applied before and after NT-3 stimulation to obtain purified NT-3 conductance. Data in Ca2+ imaging were means ± SEM from at least three independent experiments with >40 cells in each group. Cultured hippocampal neurons were electroporated with indicated siRNA or plasmids and measured at 7–9 DIV. For electrophysiology experiment, cultured hippocampal neurons were transfected with control vector or dnTRPC5 plasmids at 3 DIV and recorded at 7–9 DIV. α-Tubulin served as a loading control. NT-3 and NT-4, 50 ng/ml unless otherwise specified.
Figure 4.
Figure 4.
TrkC mediated the activation of TRPC5 by NT-3. Fura-2 AM imaging showed [Ca2+]i changes in the neurons. A–D, Effect of NT-3 on [Ca2+]i elevation in the presence or absence of 200 nm K252a (A) or in the neurons transfected with N.C. or siTrkA (B), siTrkB (C), or siTrkC (D). E, F, Effect of NT-4 on [Ca2+]i elevation in the presence or absence of 200 nm K252a (E) or in the neurons transfected with N.C. siRNA or siTrkB (F). Insets, representative immunoblots showing the specific knockdown of endogenous TrkA (B), TrkB (C, F) or TrkC (D) in the neurons. Cultured hippocampal neurons were electroporated with indicated siRNA and imaged at 7–9 DIV. G, Effect of NT-3 or LaCl3 on [Ca2+]i elevation in HEK293 cells expressing TRPC5 and TrkC either individually or in combination. Upper line, Time scale with indicated stimulations. ES, extracellular solution. Inset, representative immunoblots showing the expression of exogenous TrkC and TRPC5 in the cells. H, Statistics for A–G, *p < 0.05; **p < 0.01. Corresponding bar charts show the normalized area of ΔR/R0 curves within stimulation. Data were means ± SEM from at least three independent experiments with >40 cells in each group.
Figure 5.
Figure 5.
NT-3 activated TRPC5 through PLCγ. Fura-2 AM imaging showed [Ca2+]i changes in the neurons. A, C, NT-3-induced [Ca2+]i elevation in the presence of 30 μm 3-NC or the inactive analog 7-OH-3-NC. p = 0.012 vs 7-OH-3-NC. B, C, NT-4-induced [Ca2+]i elevation in the presence of 30 μm 3-NC or 7-OH-3-NC. p = 0.004 vs 7-OH-3-NC. C, Statistics of the normalized area of ΔR/R0 curves induced by indicated neurotrophins shown in A and B. Data were means ± SEM from at least three independent experiments with >60 cells in each group. D, Representative immunoblot shows that TrkC was immunoprecipitated (IP) with TRPC5 and PLCγ1, but not TRPC6, TRPC3, CaMKIIα, CaMKIIβ, and CaMKIγ. IgG served as a negative control. Asterisk indicates the IgG heavy chain.
Figure 6.
Figure 6.
NT-3 or NT-4 regulated dendritic growth via TRPC5 or TRPC6, respectively. A, Representative images for the neurons transfected with shTRPC5i or shTRPC6i and stimulated with NT-3. B, Quantification of total dendritic tips for the neurons shown in A. Scramble vehicle: 27.50 ± 1.35; scramble NT-3: 21.73 ± 1.22; shTRPC5i vehicle: 33.21 ± 1.93; shTRPC5i NT-3: 29.59 ± 1.67; shTRPC6i vehicle: 22.07 ± 1.76; shTRPC6i NT-3: 18.00 ± 2.48. C, Quantification of total dendritic length for the neurons shown in A. In μm, scramble vehicle: 1231.00 ± 64.36; scramble NT-3: 785.90 ± 50.85; shTRPC5i vehicle: 1529.00 ± 86.70; shTRPC5i NT-3: 1504.00 ± 85.68; shTRPC6i vehicle: 818.08 ± 43.00; shTRPC6i NT-3: 595.70 ± 76.82. *p < 0.05; **p < 0.01. D, E, Sholl analyses of the neurons shown in A. F, Representative images for the neurons transfected with shTRPC6i and stimulated with NT-4. G, Quantification of total dendritic tips for the neurons shown in F. Scramble vehicle: 27.50 ± 1.93; scramble NT-4: 40.30 ± 3.54; shTRPC6i vehicle: 17.02 ± 1.00; shTRPC6i NT-4: 20.60 ± 1.41. H, Quantification of total dendritic length for the neurons shown in F. In μm, scramble vehicle: 1231.43 ± 97.46; scramble NT-4: 1735.08 ± 85.61; shTRPC6i vehicle: 722.05 ± 35.50; shTRPC6i NT-4: 746.78 ± 38.08. *p < 0.05; **p < 0.01. I, J, Sholl analyses of the neurons shown in F. Culture hippocampal neurons were transfected with indicated shRNAi at 3 DIV, stimulated with neurotrophin at 5 DIV for 48 h and observed at 7 DIV. Scale bar: 50 μm. Data were means ± SEM from three independent experiments with >30 neurons in each group. The numbers of neurons analyzed are shown inside the bars.
Figure 7.
Figure 7.
NT-3 inhibited dendritic growth through TRPC5-CaMKIIα pathway. A, NT-3 enhanced the CaMKIIα or CaMKIIβ phosphorylation at Thr286 or Thr287, respectively, in a time-dependent manner. B, Statistics for A. C, NT-4 enhanced CaMKIV phosphorylation at Thr196. D, Statistics for C. Cell lysates were extracted from cultured hippocampal neurons at 7 DIV. E, Knocking down TRPC5 abolished NT-3-induced CaMKII activation. Cell lysates extracted from the neurons electroporated with siTRPC5 and treated with NT-3 for 15 min were Western-blotted with indicated antibodies. F, Statistics for E. G, TRPC5 was necessary and sufficient to activate CaMKIIα. Immunoblots showed that increasing TRPC5 expression raised the CaMKIIα phosphorylation level in the neurons and that, conversely, decreasing TRPC5 expression lowered both the CaMKIIα and the CaMKIIβ phosphorylation levels in the neurons. Cell lysates were extracted from the neurons electroporated with TRPC5 or siTRPC5 at 4 DIV. H, Statistics for G. α-Tubulin served as a loading control. I, Representative images for the neurons transfected with TRPC5 or the dnCaMKIIα individually or in combination at 4–5 DIV and observed at 9–10 DIV. Scale bar: 50 μm. J, Quantification of total dendritic tips of the neurons shown in I. Control (Crtl), 35.80 ± 1.67; TRPC5, 23.48 ± 1.54; dnCaMKIIα, 42.87 ± 1.70; TRPC5 plus dnCaMKIIα, 38.70 ± 1.69. K, Quantification of total dendritic length of the neurons shown in I. In μm, control (Ctrl), 1481.71 ± 46.05; TRPC5, 1058.63 ± 62.71; dnCaMKIIα, 1882.03 ± 69.00; TRPC5 plus dnCaMKIIα, 1788.68 ± 45.06. L, M, Sholl analyses of the neurons shown in I. The numbers of neurons analyzed shown within the bar. Data were means ± SEM from at least three independent experiments. *p < 0.05; **p < 0.01.
Figure 8.
Figure 8.
Schematic diagram of the signaling pathways underline the opposing roles of TRPCs in dendrite development. The Ca2+ influx through TRPC5 triggered by NT-3-TrkC-PLCγ activates CaMKII and initiates a negative regulation on dendrite development. In contrast, the Ca2+ influx through TRPC6 triggered by NT-4/BDNF-TrkB-PLCγ activates CaMKIV and initiates a positive regulation on dendrite development.

Similar articles

Cited by

References

    1. Abraham ST, Benscoter HA, Schworer CM, Singer HA. A role for Ca2+/calmodulin-dependent protein kinase II in the mitogen-activated protein kinase signaling cascade of cultured rat aortic vascular smooth muscle cells. Circ Res. 1997;81:575–584. - PubMed
    1. Allan D, Michell RH. A calcium-activated polyphosphoinositide phosphodiesterase in the plasma membrane of human and rabbit erythrocytes. Biochim Biophys Acta. 1978;508:277–286. - PubMed
    1. Amaral MD, Pozzo-Miller L. TRPC3 channels are necessary for brain-derived neurotrophic factor to activate a nonselective cationic current and to induce dendritic spine formation. J Neurosci. 2007;27:5179–5189. - PMC - PubMed
    1. Andrade R. Cell excitation enhances muscarinic cholinergic responses in rat association cortex. Brain Res. 1991;548:81–93. - PubMed
    1. Averbuch-Heller L, Pruginin M, Kahane N, Tsoulfas P, Parada L, Rosenthal A, Kalcheim C. Neurotrophin 3 stimulates the differentiation of motoneurons from avian neural tube progenitor cells. Proc Natl Acad Sci U S A. 1994;91:3247–3251. - PMC - PubMed

Publication types

MeSH terms

LinkOut - more resources