

Medial temporal lobe epilepsy is associated with neuronal fibre loss and paradoxical increase in structural connectivity of limbic structures
- PMID: 22764263
- PMCID: PMC3415309
- DOI: 10.1136/jnnp-2012-302476
Medial temporal lobe epilepsy is associated with neuronal fibre loss and paradoxical increase in structural connectivity of limbic structures
Abstract
Background: It has been hypothesised that seizure induced neuronal loss and axonal damage in medial temporal lobe epilepsy (MTLE) may lead to the development of aberrant connections between limbic structures and eventually result in the reorganisation of the limbic network. In this study, limbic structural connectivity in patients with MTLE was investigated, using diffusion tensor MRI, probabilistic tractography and graph theory based network analysis.
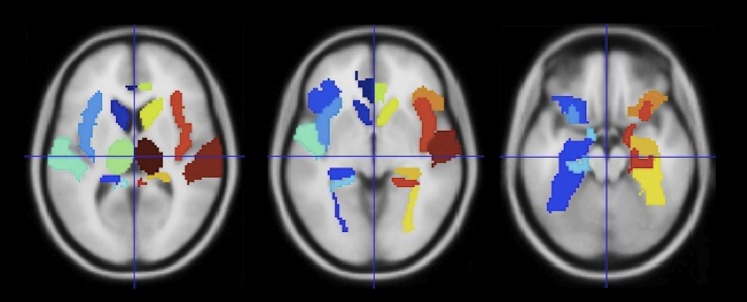
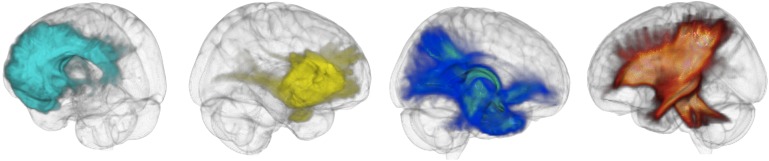
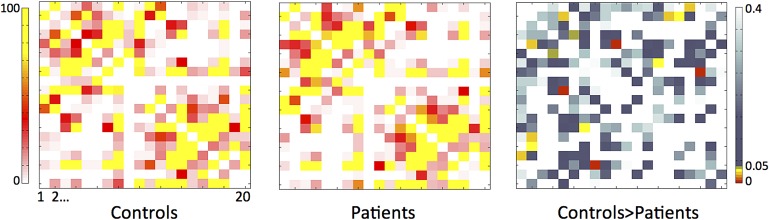
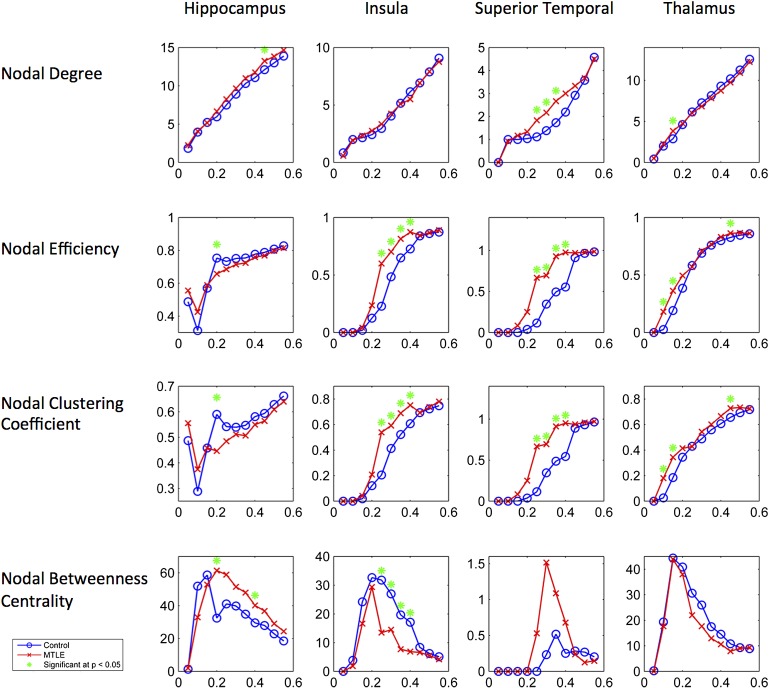
Methods: 12 patients with unilateral MTLE and hippocampal sclerosis (five left and seven right MTLE) and 26 healthy controls were studied. The connectivity of 10 bilateral limbic regions of interest was mapped with probabilistic tractography, and the probabilistic fibre density between each pair of regions was used as the measure of their weighted structural connectivity. Binary connectivity matrices were then obtained from the weighted connectivity matrix using a range of fixed density thresholds. Graph theory based properties of nodes (degree, local efficiency, clustering coefficient and betweenness centrality) and the network (global efficiency and average clustering coefficient) were calculated from the weight and binary connectivity matrices of each subject and compared between patients and controls.
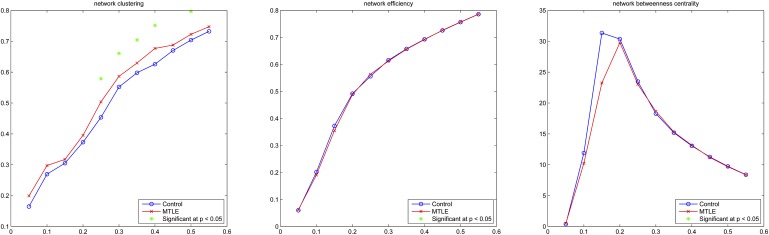
Results: MTLE was associated with a regional reduction in fibre density compared with controls. Paradoxically, patients exhibited (1) increased limbic network clustering and (2) increased nodal efficiency, degree and clustering coefficient in the ipsilateral insula, superior temporal region and thalamus. There was also a significant reduction in clustering coefficient and efficiency of the ipsilateral hippocampus, accompanied by increased nodal degree.
Conclusions: These results suggest that MTLE is associated with reorganisation of the limbic system. These results corroborate the concept of MTLE as a network disease, and may contribute to the understanding of network excitability dynamics in epilepsy and MTLE.
Conflict of interest statement
Figures
References
-
- Babb TL, Brown WJ. Pathological findings in epilepsy. In: Engel J, Jr, ed. Surgical treatment of the epilepsies. New York: Raven Press, 1987:511–40
-
- Bernasconi N, Duchesne S, Janke A, et al. Whole-brain voxel-based statistical analysis of gray matter and white matter in temporal lobe epilepsy. Neuroimage 2004;23:717–23 - PubMed
-
- Keller SS, Mackay CE, Barrick TR, et al. Voxel-based morphometric comparison of hippocampal and extrahippocampal abnormalities in patients with left and right hippocampal atrophy. Neuroimage 2002;16:23–31 - PubMed
-
- McDonald CR, Hagler DJ, Jr, Ahmadi ME, et al. Regional neocortical thinning in mesial temporal lobe epilepsy. Epilepsia 2008;49:794–803 - PubMed
Publication types
MeSH terms
Grants and funding
LinkOut - more resources
Full Text Sources