Review
. 2013 May:243:4-20.
doi: 10.1016/j.expneurol.2012.06.026. Epub 2012 Jul 2.

Neuroanatomy of the extended circadian rhythm system

Affiliations
Review

Neuroanatomy of the extended circadian rhythm system

Lawrence P Morin. Exp Neurol. 2013 May.

Abstract

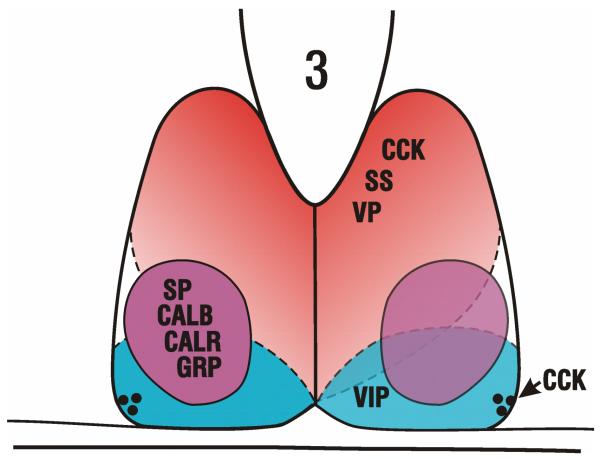
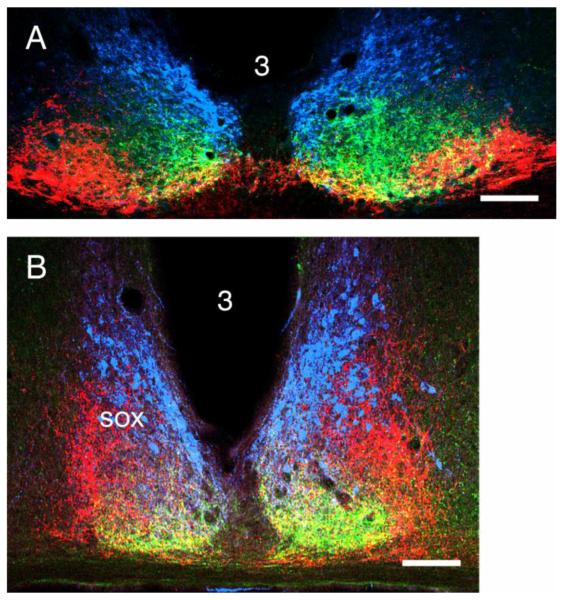
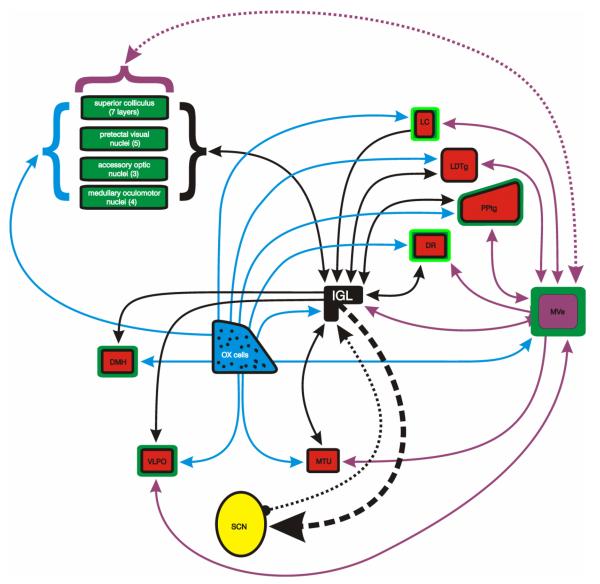
The suprachiasmatic nucleus (SCN), site of the primary clock in the circadian rhythm system, has three major afferent connections. The most important consists of a retinohypothalamic projection through which photic information, received by classical rod/cone photoreceptors and intrinsically photoreceptive retinal ganglion cells, gains access to the clock. This information influences phase and period of circadian rhythms. The two other robust afferent projections are the median raphe serotonergic pathway and the geniculohypothalamic (GHT), NPY-containing pathway from the thalamic intergeniculate leaflet (IGL). Beyond this simple framework, the number of anatomical routes that could theoretically be involved in rhythm regulation is enormous, with the SCN projecting to 15 regions and being directly innervated by about 35. If multisynaptic afferents to the SCN are included, the number expands to approximately brain 85 areas providing input to the SCN. The IGL, a known contributor to circadian rhythm regulation, has a still greater level of complexity. This nucleus connects abundantly throughout the brain (to approximately 100 regions) by pathways that are largely bilateral and reciprocal. Few of these sites have been evaluated for their contributions to circadian rhythm regulation, although most have a theoretical possibility of doing so via the GHT. The anatomy of IGL connections suggests that one of its functions may be regulation of eye movements during sleep. Together, neural circuits of the SCN and IGL are complex and interconnected. As yet, few have been tested with respect to their involvement in rhythm regulation.


Figures

Figure 1
Figure 1
Schematic showing the approximate locations of cell phenotypes in the hamster SCN. The regional boundaries are “fuzzy” and should not be rigidly applied. Also, the schematic applies only to the mid-caudal part of the SCN where the SCNce is evident. For example, both VP and CCK cells occupy most of the rostral third of the nucleus. The black dots ventrolaterally signify the presence of a few CCK neurons at that location. VP – vasopressin; SS – somatostatin; CCK – cholecystokinin; SP – substance P; CALB – calbindin; CALR – calretinin; GRP – gastrin releasing peptide; VIP – vasoactive intestinal polypeptide. The figure is modified after Fig. 1 in Morin and Allen (2006).
Figure 2
Figure 2
Diagrammatic representation of brain regions receiving retinal input from melanopsin-containing ipRGCs (blue lines; red fill) in the mouse (data from (Hattar, et al., 2006; Ecker, et al., 2010). The figure also identifies retinorecipient regions not innervated by ipRGCs (unfilled). Connections of the IGL with nuclei of the subcortical visual shell are also shown (green lines). The reciprocal connections between the DR and MnR, and the MnR to SCN projections are identified by yellow fill and yellow lines. The figure is modified after Fig. 21.3 in (Morin, 2012).
Figure 3
Figure 3
SCN schematic showing the relative positions of (A) retinal terminal fields, and (B) geniculohypothalamic tract terminal field (left side) containing terminals from four IGL neuron classes (NT – neurotensin; NPY – neuropeptide Y; ENK – enkephalin; GABA – gamma amino butyric acid) and (right side) the variably dense serotonergic (5-HT – serotonin) terminal field. In (A), the red area indicates the region of densest retinal input which arrives predominately from the contralateral retina. The green region indicates the area receiving input predominately from the ipsilateral retina. Note that the density is not uniform for any terminal distribution. As for Fig. 1, the boundaries should not be rigidly applied. The figure is modified after Fig. 1 in Morin and Allen (2006).
Figure 4
Figure 4
Triple label images of SCN anatomy in (A) the rat and (B) mouse stained for vasopressin (blue), serotonin (green) and retinal projections (red). The yellow color does not indicate co-localization. Rather, it results from merging information from adjacent red and green pixels or because green and red items are superimposed in the original tissue. The oblate rat SCN enables the triple stain procedure to give the tissue a laminar appearance not visible in the more upright SCN of the mouse. The figure is modified after Figs. 5 and 8 in Morin et al. (2006).
Figure 5
Figure 5
(A) Parasagittal section through the hamster SCN showing GnRH fibers and terminals in rostral part of the nucleus and surrounding hypothalamus, but absent from the caudal SCN (arrow). (B-D) Coronal images of the SCN showing GnRH fibers and terminals in the SCN and adjacent hypothalamus, but also showing their absence from the SCNce (arrow). ox – optic chiasm; sox – supraoptic commissure. Bar = 100 μm.
Figure 6
Figure 6
Schematic showing diencephalic and basal forebrain areas receiving projections from the SCN (black pathways) and IGL (red pathways). Blue fill identifies regions receiving input from both SCN and IGL; those receiving only IGL input have red fill. One region (PM) has yellow fill and is the only target of SCN projections that does not also receive input from the IGL. Line thickness indicates relative size of the projection. See the list of Abbreviations for anatomical names.
Figure 7
Figure 7
Schematic presentation emphasizing the relationship between the IGL and sleep-regulatory nuclei (red fill), nuclei of the orexin system (blue fill and blue projections), nuclei of the visuomotor system (green fill or green outline) and the vestibular system (purple fill and purple projections). The dotted line between the MVe and superior colliculus indicates that only the deep gray later is connected reciprocally with the MVe, although there is also an intermediate gray projection to MVe. The GHT is indicated by the thick dashed line from IGL to SCN and the putative reciprocal connection by thinner dotted line.

References

    1. Abrahamson EE, Leak RK, Moore RY. The suprachiasmatic nucleus projects to posterior hypothalamic arousal systems. Neuroreport. 2001;12:435–440. - PubMed
    1. Abrahamson EE, Leak RK, Moore RY. The suprachiasmatic nucleus projects to posterior hypothalamic arousal systems. Neuroreport. 2001;12:435–440. - PubMed
    1. Abrahamson EE, Moore RY. Suprachiasmatic nucleus in the mouse: retinal innervation, intrinsic organization and efferent projections. Brain Research. 2001;916:172–191. - PubMed
    1. Aioun J, Chambille I, Peytevin J, Martinet L. Neurons containing gastrin-releasing peptide and vasoactive intestinal polypeptide are involved in the reception of the photic signal in the suprachiasmatic nucleus of the Syrian hamster: an immunocytochemical ultrastructural study. Cell Tissue Res. 1998;291:239–253. - PubMed
    1. Albers HE, Ferris CF. Neuropeptide Y: role in light-dark entrainment of hamster circadian rhythms. Neuroscience Letters. 1984;50:163–168. - PubMed

Publication types

MeSH terms