. 2012 Dec 1:100:229-39.
doi: 10.1016/j.colsurfb.2012.05.028. Epub 2012 Jun 7.

Effect of viscous drag on multiple receptor-ligand bonds rupture force

Affiliations

Effect of viscous drag on multiple receptor-ligand bonds rupture force

V K Gupta. Colloids Surf B Biointerfaces. .

Abstract

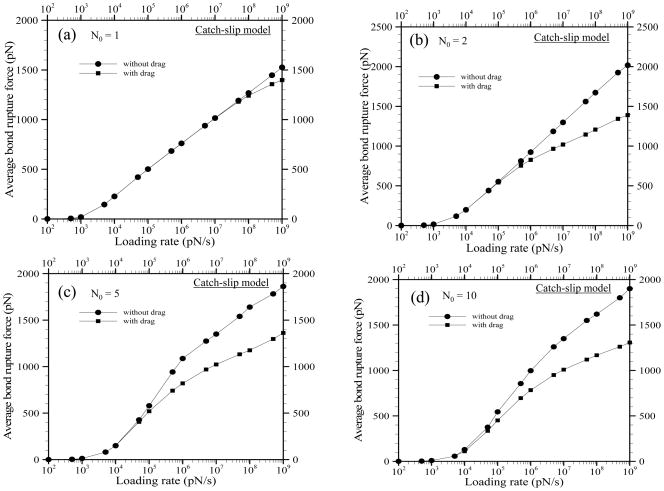
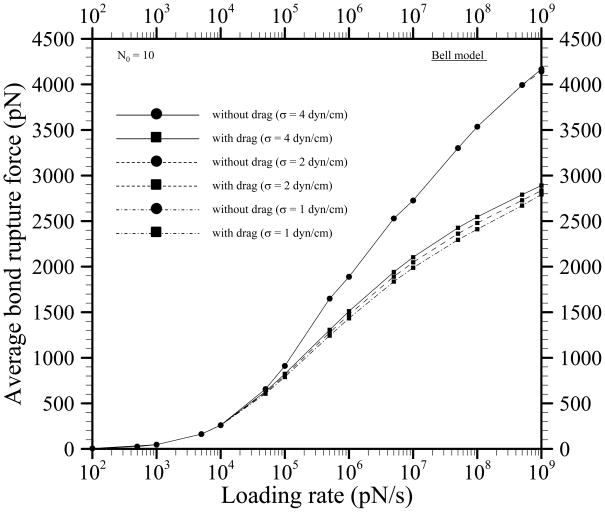
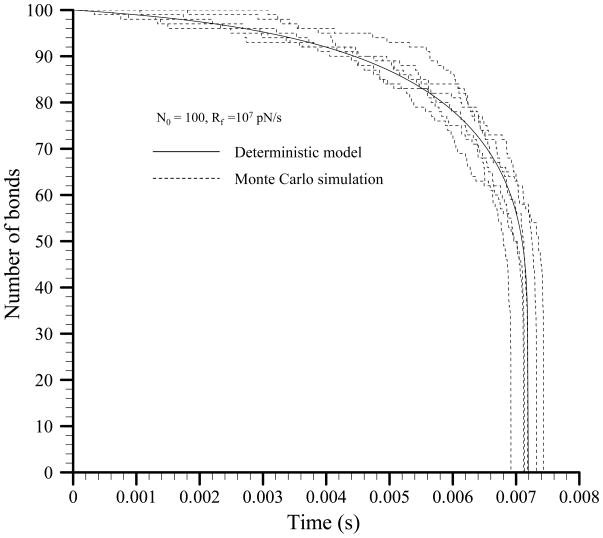
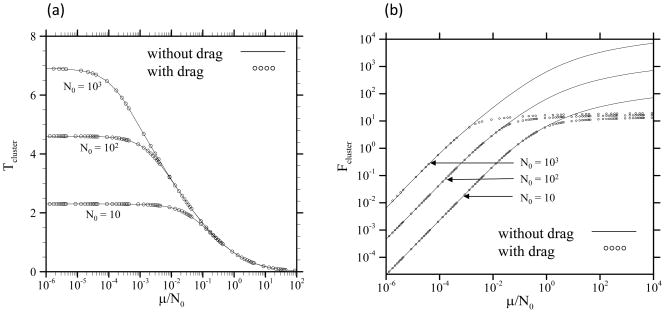
Monte Carlo simulation of the rupture of multiple receptor-ligand bonds between two PMN cells suspended in a Newtonian fluid is performed. We demonstrate via micro-mechanical model of two cells adhered by multiple receptor-ligand bonds that viscous drag caused by relative motion of cell suspended in a Newtonian fluid modulates transmission of an applied external load to bonds. Specifically, it is demonstrated that at any time the intermolecular bond force is not equivalent to the instantaneous applied force. The difference in the instantaneous applied force and the intermolecular bond force depends on the viscosity of fluid, the size of cell, the applied loading rate, and the number of bonds at any instant of time. Viscous drag acting on cell reduces average bond rupture forces.


Figures

Figure 1
Figure 1
Schematic of two PMN cells detachment (not drawn to scale) through binding between PSGL-1 (receptor) and L-selectin (ligand) molecules concentrated on the tip of PMN microvillus.
Figure 2
Figure 2
Time variation of the cell velocity (solid lines) and the number of bonds (dashed lines) obtained from micro-mechanical model simulation at loading rate Rf = 107 pN/s for the initial number of bonds N0 = 5.
Figure 3
Figure 3
Time variation of drag force acting on cell (a) for N0 = 2 at three different Rf (b) for N0 = 1, 2, 5, 10 at Rf = 107 pN/s obtained from micro-mechanical model simulations for the model parameters listed in Table 1.
Figure 4
Figure 4
Time variation of applied force (solid line) and intermolecular bond force for N0 = 1 (dashed lines), N0 = 2 (dashed dot lines), N0 = 5 (long dashed lines), and N0 = 10 (dashed dot dot lines) at (a) Rf = 103 pN/s (b) Rf = 105 pN/s (c) Rf = 107 pN/s obtained from micro-mechanical model simulations for the model parameters listed in Table 1. Panel (d) shows time variation of applied force (solid line) and intermolecular bond force for N0 = 2 at Rf = 107 pN/s and η = 1 cP (dashed lines), η = 2 cP (dashed dot lines), η = 3 cP (long dashed lines), and η = 4 cP (dashed dot dot lines).
Figure 5
Figure 5
Average bond rupture force as a function of loading rate for (a) N0 = 1, (b) N0 = 2, (c) N0 = 5, and (d) N0 = 10 obtained from the micro-mechanical model simulations utilizing the Bell model for the model parameters listed in Table 1.
Figure 6
Figure 6
Average bond rupture force as a function of loading rate for (a) N0 = 1, (b) N0 = 2, (c) N0 = 5, and (d) N0 = 10 obtained from the micro-mechanical model simulations utilizing the two-state (catch-slip) model for the model parameters listed in Table 1.
Figure 7
Figure 7
Effect of bond spring constant on the average bond rupture force as a function of loading rate for N0 = 10 at σ = 4 dyn/cm (solid lines), σ = 2 dyn/cm (dashed lines), and σ = 1 dyn/cm (dashed dot lines) obtained from the micro-mechanical model simulations utilizing the Bell model for the model parameters listed in Table 1.
Figure 8
Figure 8
Number of bonds as a function of time obtained from the deterministic model simulation (solid lines) at Rf = 107 pN/s, N0 = 100. A few representative trajectories for the number of bonds as a function of time obtained from the Monte Carlo simulation at Rf = 107 pN/s, N0 = 100 are shown as dashed lines.
Figure 9
Figure 9
Solid lines: deterministic results for (a) cluster lifetime Tcluster and (b) cluster rupture force Fcluster for the case of vanishing rebinding and in absence of both inertia and viscous drag as a function of μ=N0 for N0 = 10, 102, and 103. Broken lines: curves for all three scaling regimes.
Figure 10
Figure 10
Solid lines: deterministic results for (a) cluster lifetime Tcluster and (b) cluster rupture force Fcluster for the case of vanishing rebinding and in absence of both inertia and viscous drag as a function of μ=N0 for N0 = 10, 102, and 103. Symbols: corresponding results in presence of both inertia and viscous drag.

References

    1. Bell GI. Science. 1978;200:618. - PubMed
    1. McEver RP, Moore KL, Cummings RD. J Biol Chem. 1995;270:11025. - PubMed
    1. Bruinsma R, Behrisch A, Sackmann E. Phys Rev E. 2000;61:4253. - PubMed
    1. Bershadsky AD, Balaban NQ, Geiger B. Annu Rev Cell Dev Biol. 2003;19:677. - PubMed
    1. Mustard JF, Packham MA, Kinlough Rathbone RL, Perry DW, Regoeczi E. Blood. 1978;52:453. - PubMed

Publication types

LinkOut - more resources