Review
. 2012 Aug;25(4):384-91.
doi: 10.1097/WCO.0b013e328355a8e8.

Network assemblies in the functional brain

Affiliations
Review

Network assemblies in the functional brain

Jorge Sepulcre et al. Curr Opin Neurol. 2012 Aug.

Abstract

Purpose of review: This review focuses on recent advances in functional connectivity MRI and renewed interest in studying the large-scale functional network assemblies in the brain. We also consider some methodological aspects of graph theoretical analysis.

Recent findings: Recent years have witnessed a rapid increase in the number of studies that apply network science to neuroscience. A major motivation comes from the fields of neurology and psychiatry, where a central goal is the characterization of the functional connectome of the brain under normal and pathological conditions. Recent findings have provided new insights into the pivotal role of network epicenters and specific configurations of large-scale functional networks in the brain.

Summary: Functional connectivity MRI and corresponding analytical tools continue to reveal novel properties of the functional organization of the brain, which will in turn be key for understanding pathologies in neurology.


Figures

Figure 1
Figure 1
The human brain is organized in regions of predominant local and distant functional connectivity (A). Local hubs are located in primary and secondary information processing regions and also in an ACC region previously associated with self and interceptive information processing (adapted from [5]). The cortical hubs of the human brain associate widespread brain regions most likely supporting the integration of cognitive functions (B) (adapted from [32]). Example of a recent study separating distinct set of functional connectivity networks at different levels of clustering (C; partition in 7 networks in left side; partition in 17 networks in right side) (adapted from [3]).
Figure 2
Figure 2
The temporo-parietal joint is a pivotal hub for the control, default mode and ventral attention networks (A) (adapted from [46]). PCC/precuneus is pivotal hub for the convergence of internal thoughts and cognitive control systems (B) (adapted from [47]).
Figure 3
Figure 3
Recent findings in the literature have described in more detail the hierarchical organization of the human brain, from modal cortices to attentional networks and high order cognitive networks. Three examples of the functional connectivity structure between networks are shown in (A; adapted from [48]), (B; adapted from [49]) and (C; adapted from [50]).
Figure 4
Figure 4
(A) shows that primary systems, such as the visual cortex, merge the cortical hubs of the human brain through attentional and multimodal areas of the human brain (areas previously reported, for instance, in [52, 62]). (B) shows that task activity change the linkscapes of the brain and produce alternative connectivity pathways specific to task contingencies. In (A) and (B) we use a stepwise functional connectivity (SFC) approach in which the degree of stepwise connectivity (Djl) is computed from the count of all paths that connect voxel j to a seed voxel i (V1 region) in an exactly length of l (where l is the specific link-step distance). To aid visualization, all surface SFC images were displayed using a normalized color scale from 0 to 1, where 0 is the intensity corresponding to the one-sample t-test p-value of 0.0001 and 1 is the maximum intensity of the image corresponding to the smallest one-sample t-test p-value. We used Pajek software [63] and Kamada-Kawai energy layout [64] for the network graphs displays. Nodes were obtained from all main results displayed in the cortical maps. We used an average-linkage hierarchical clustering analysis to highlight the modules of the networks. Red arrows show the main merging points between networks. Only nodes that are key in the transition between networks are labeled in the cortical maps and graphs. VS: visual seed region; DO: dorsal occipital; OP: operculum parietale; SPL: superior parietal lobe; IN: insula; LP: lateral prefrontal; MF: mid Frontal; VO: ventral occipital; LPa: lateral parietal; TE: Temporal.

References

    1. Beckmann CF, Smith SM. Probabilistic independent component analysis for functional magnetic resonance imaging. IEEE Trans Med Imaging. 2004;23(2):137–52. - PubMed
    1. Bellec P, et al. Multi-level bootstrap analysis of stable clusters in resting-state fMRI. Neuroimage. 2010;51(3):1126–39. - PubMed
    1. Yeo BT, et al. The organization of the human cerebral cortex estimated by intrinsic functional connectivity. J Neurophysiol. 2011;106(3):1125–65. - PMC - PubMed
    1. Bullmore ET, Bassett DS. Brain graphs: graphical models of the human brain connectome. Annu Rev Clin Psychol. 2011;7:113–40. - PubMed
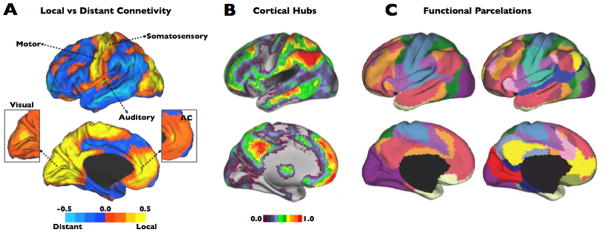
    1. Sepulcre J, et al. The organization of local and distant functional connectivity in the human brain. PLoS Comput Biol. 2010;6(6):e1000808. This paper describes the organization of local and distant functional connectivity in the human brain and suggests that the brain has evolved a physical connectivity balance that optimizes information-processing efficiency across different classes of specialized areas. - PMC - PubMed

Publication types