. 2012 Sep;53(9):2002-13.
doi: 10.1194/jlr.D029546. Epub 2012 Jul 4.

Saturated fatty acids activate TLR-mediated proinflammatory signaling pathways

Affiliations

Saturated fatty acids activate TLR-mediated proinflammatory signaling pathways

Shurong Huang et al. J Lipid Res. 2012 Sep.

Abstract

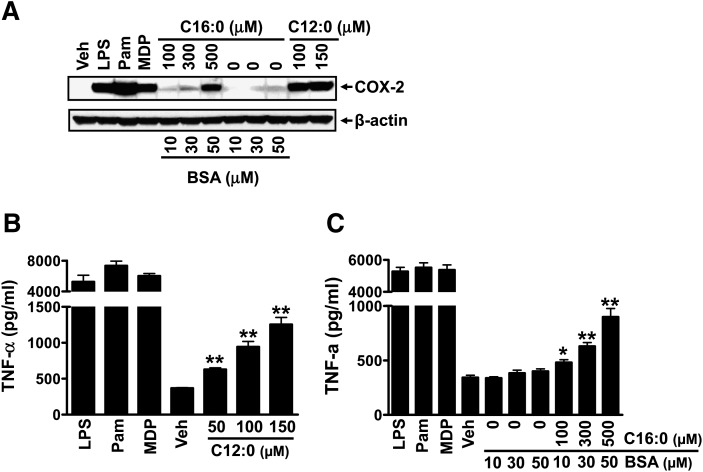
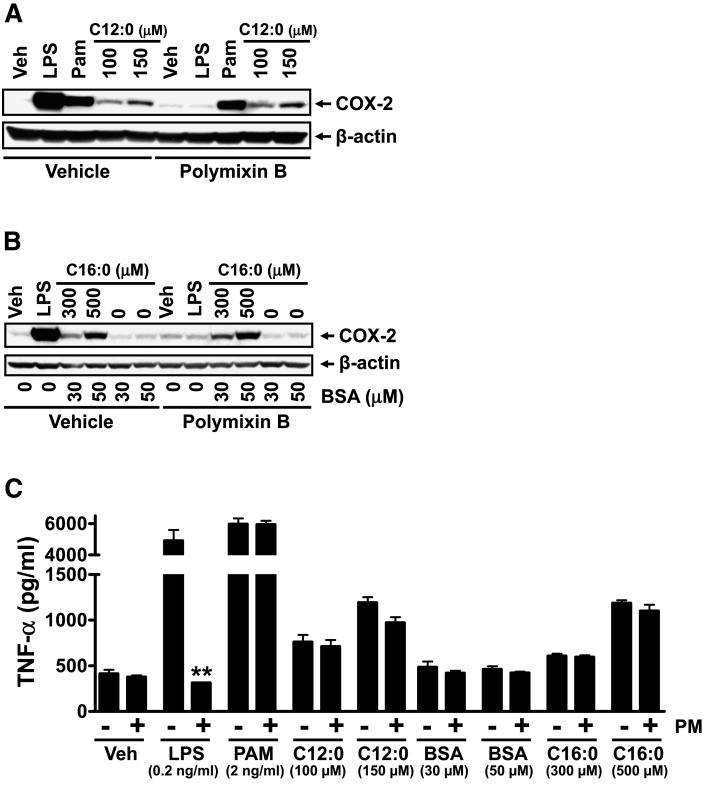
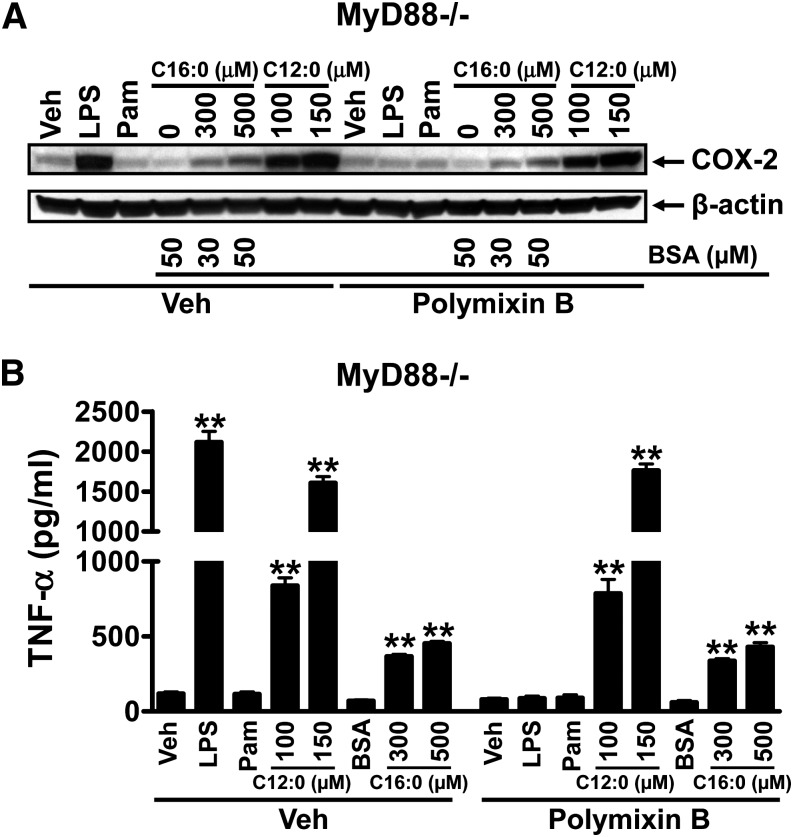
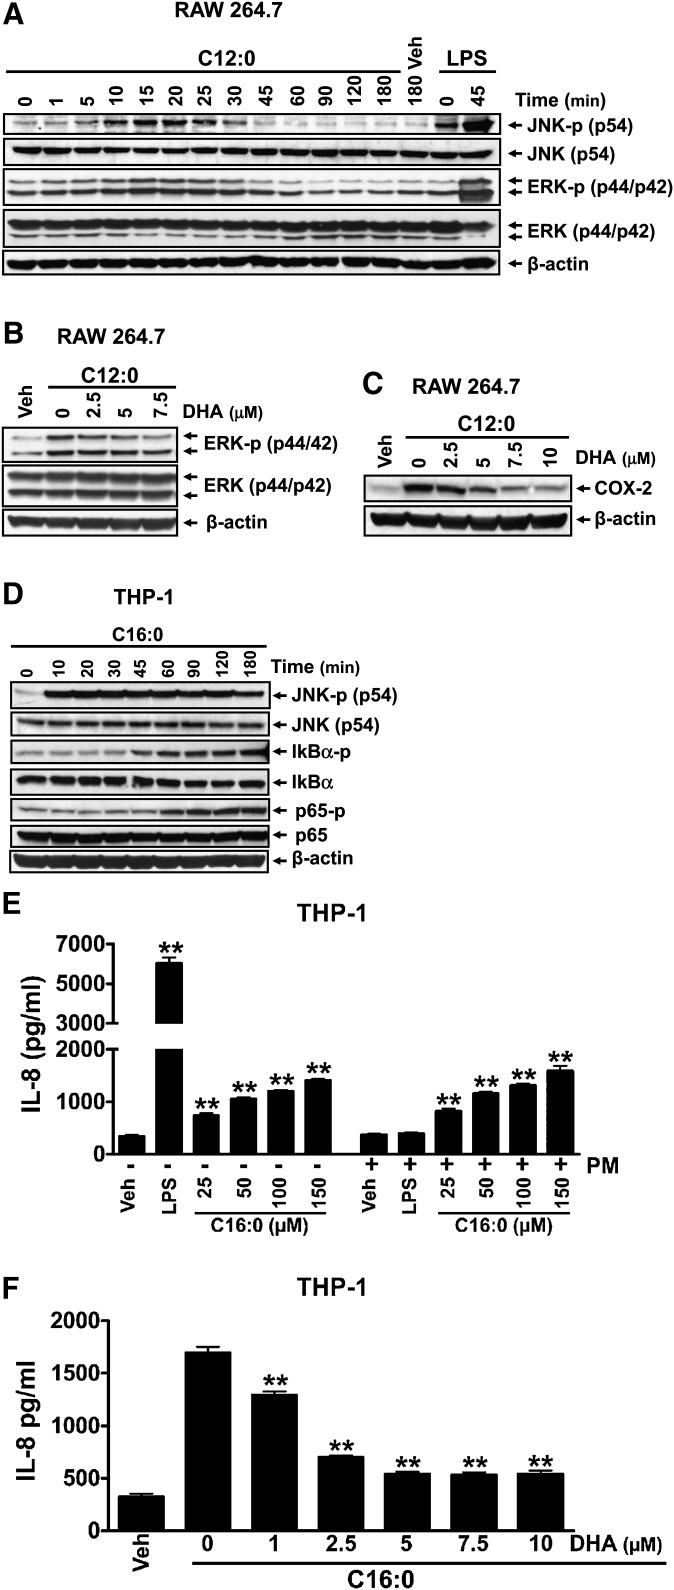
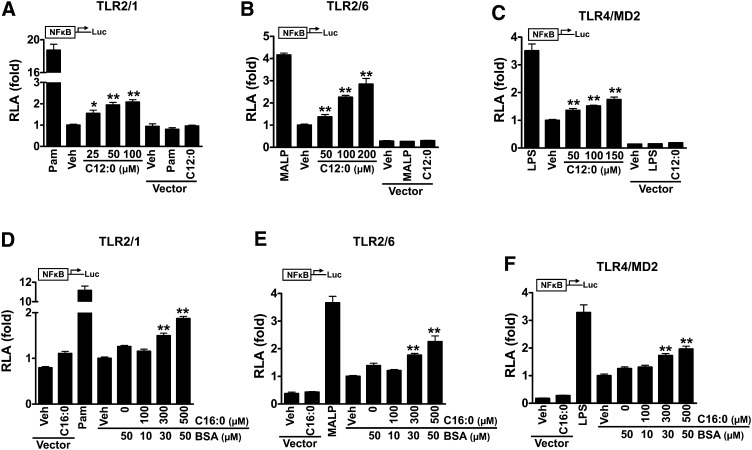
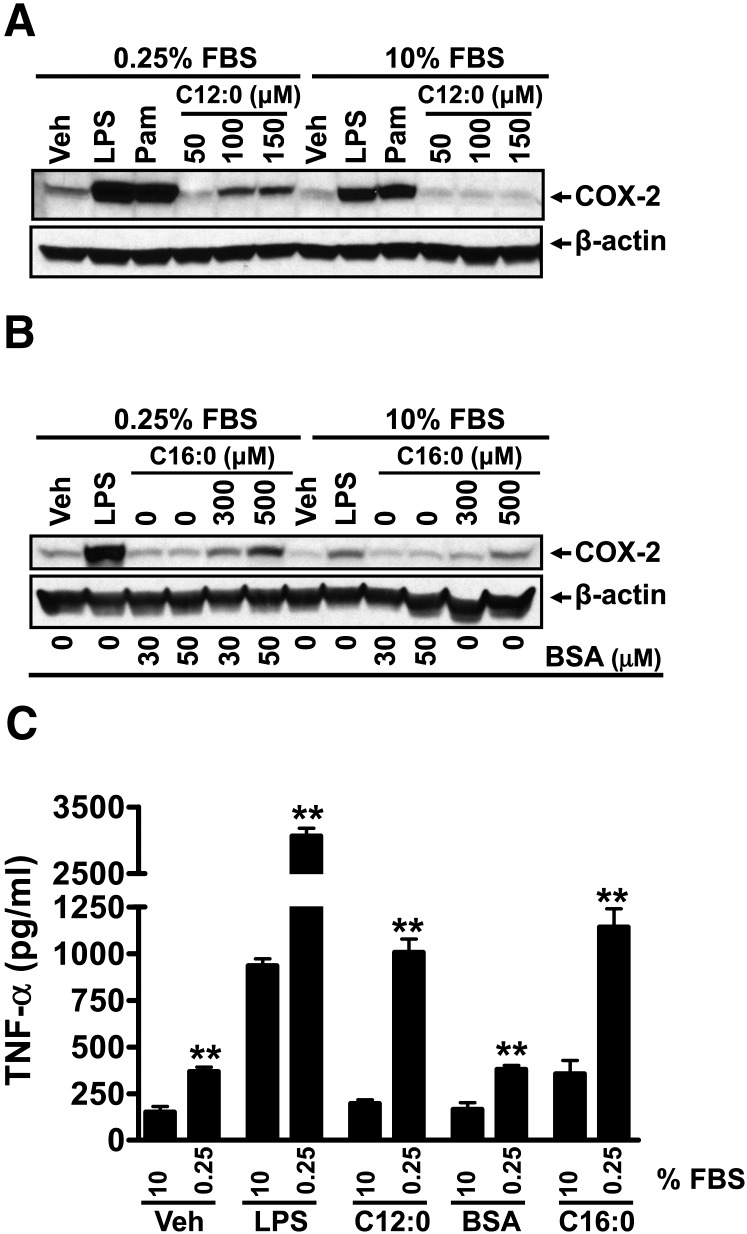
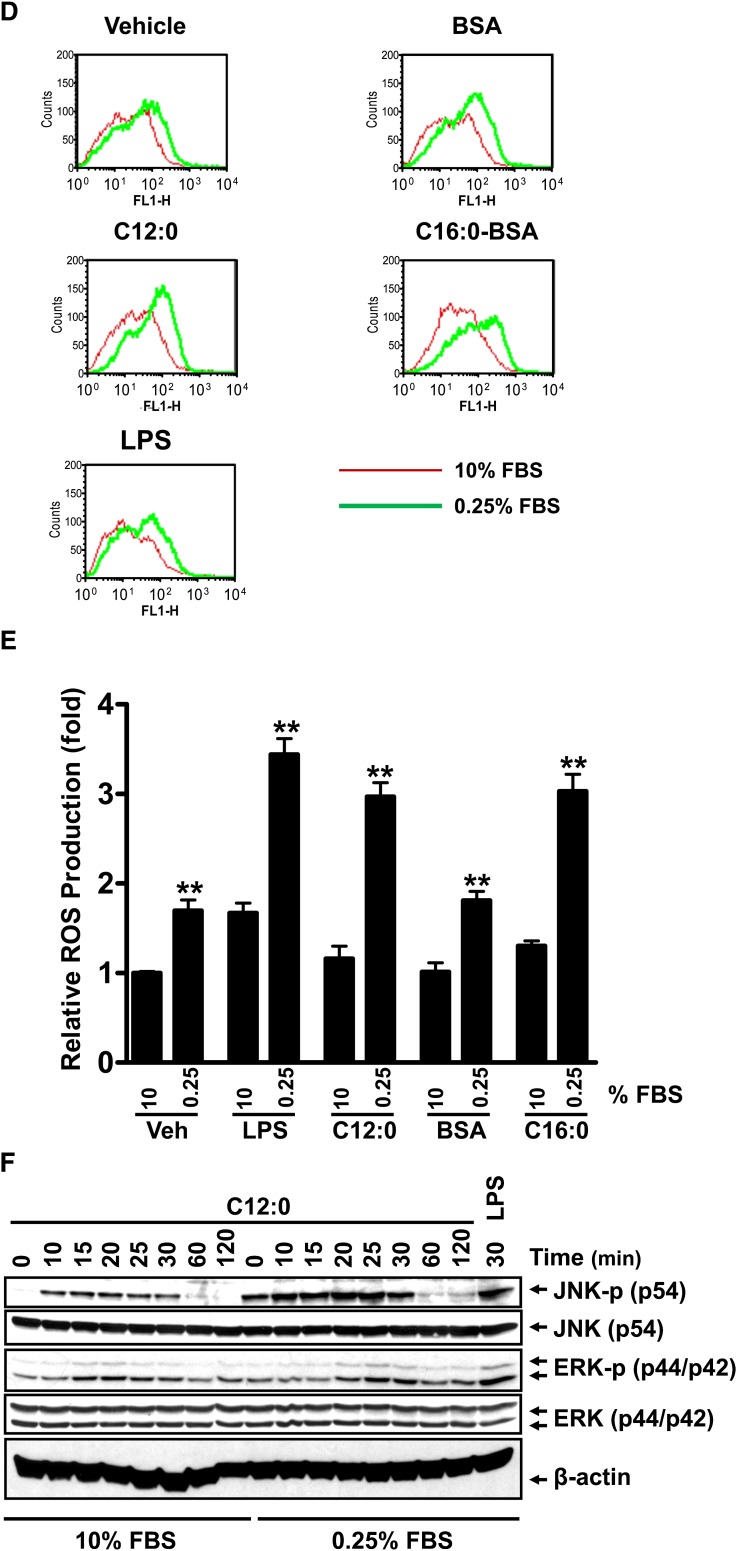
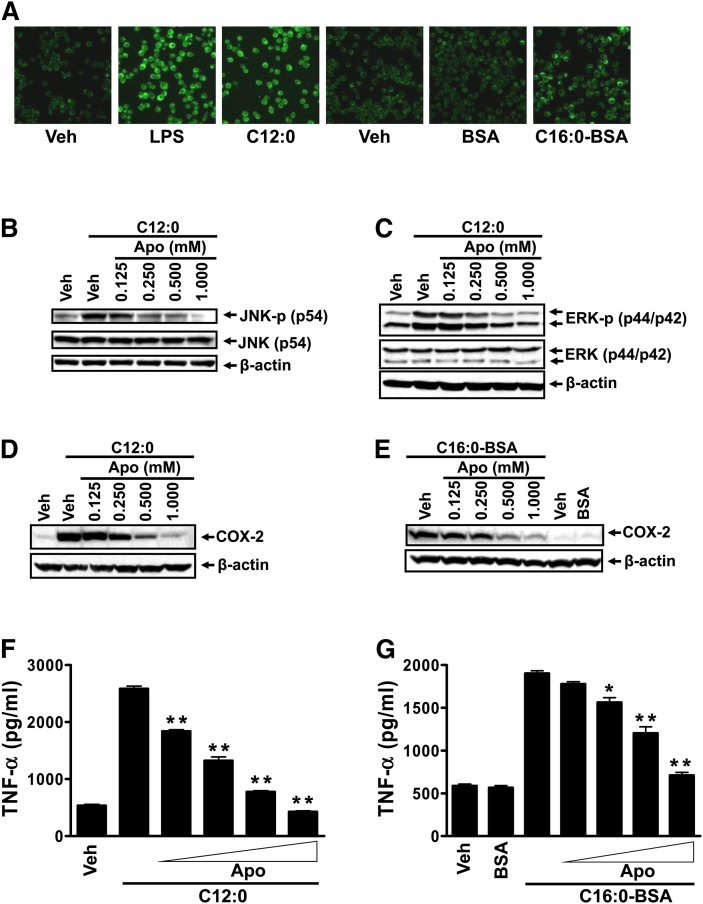
Toll-like receptor 4 (TLR4) and TLR2 were shown to be activated by saturated fatty acids (SFAs) but inhibited by docosahexaenoic acid (DHA). However, one report suggested that SFA-induced TLR activation in cell culture systems is due to contaminants in BSA used for solubilizing fatty acids. This report raised doubt about proinflammatory effects of SFAs. Our studies herein demonstrate that sodium palmitate (C16:0) or laurate (C12:0) without BSA solubilization induced phosphorylation of inhibitor of nuclear factor-κB α, c-Jun N-terminal kinase (JNK), p44/42 mitogen-activated-kinase (ERK), and nuclear factor-κB subunit p65, and TLR target gene expression in THP1 monocytes or RAW264.7 macrophages, respectively, when cultured in low FBS (0.25%) medium. C12:0 induced NFκB activation through TLR2 dimerized with TLR1 or TLR6, and through TLR4. Because BSA was not used in these experiments, contaminants in BSA have no relevance. Unlike in suspension cells (THP-1), BSA-solubilized C16:0 instead of sodium C16:0 is required to induce TLR target gene expression in adherent cells (RAW264.7). C16:0-BSA transactivated TLR2 dimerized with TLR1 or TLR6 and through TLR4 as seen with C12:0. These results and additional studies with the LPS sequester polymixin B and in MyD88(-/-) macrophages indicated that SFA-induced activation of TLR2 or TLR4 is a fatty acid-specific effect, but not due to contaminants in BSA or fatty acid preparations.


Figures

Fig. 1.
Fig. 1.
Sodium laurate (C12:0) and BSA-complexed palmitic acid (C16:0-BSA) but not BSA alone induced the expression of proinflammatory TLR target gene products COX-2 and TNF- α . RAW 264.7 cells were serum-starved (0.25% FBS) for 6 h in DMEM medium and then treated with C12:0, C16:0-BSA, or equivalent concentrations of BSA in the same low-serum medium for 18 h. The protein lysates were probed with anti-COX-2 or anti- β -actin antibody by immunobloting (A). Culture medium supernatants were assayed for TNF- α by ELISA (B, C). Controls: LPS (TLR4 agonist, 0.2 ng/ml), Pam (Pam3CSK4, TLR2 agonist, 2 ng/ml), MDP (NOD2 agonist, 100 µM). * P < 0.05, ** P < 0.01: significantly different from vehicle control (B) or from 50 µM BSA alone (C).
Fig. 2.
Fig. 2.
Polymixin B (LPS sequester) did not affect sodium laurate (C12:0)- or BSA-complexed palmitic acid (C16:0-BSA)-induced COX-2 expression indicating that the induction of COX-2 expression by these fatty acids is not due to LPS contamination in the fatty acid or BSA preparations. RAW 264.7 cells were serum-starved in 0.25% FBS/DMEM medium for 6 h and then pretreated with 10 ug/ml polymixin B for 1 h followed by coincubation with C12:0, C16:0-BSA, or equivalent concentrations of BSA in the same low-serum medium for 18 h. The protein lysates were probed with anti-COX-2 or anti- β -actin antibody by immunobloting (A, B). Culture medium supernatants were assayed for TNF- α by ELISA (C). Controls: 0.2 ng/ml LPS, 2 ng/ml Pam3CSK4. PM, polymixin B. ** P < 0.01: significantly different from no polymix B control (C).
Fig. 3.
Fig. 3.
Sodium laurate (C12:0) or BSA-complexed palmitic acid (C16:0-BSA) induced COX-2 and TNF- α expression in MyD88 − / − macrophages even in the presence of polymixin B, eliminating the possibility that the fatty acid effects are due to the potential contaminants in BSA or fatty acid preparations that can activate TLR4 or MyD88-dependent TLRs or IL-1 receptor. MyD88 − / − cells were serum-starved in 0.25% FBS/DMEM medium for 6 h and then treated with C12:0, C16:0-BSA, or equivalent concentrations of BSA in the same low-serum medium for 18 h. The protein lysates were probed for COX-2 and β -actin (A) and the culture medium supernatants were assayed for TNF- α (B) as described in Fig 1. Controls: LPS 5 ng/ml, Pam3CSK4 5 ng/ml. ** P < 0.01: significantly different from vehicle control or from 50 µM BSA alone (B).
Fig. 4.
Fig. 4.
Sodium salt of lauric acid (C12:0) or sodium salt of palmitic acid (C16:0) without being complexed with BSA activated the downstream signaling pathways of pattern recognition receptors (PRRs). A: RAW 264.7 cells were serum-starved in 0.25% FBS/DMEM for 6 h and then treated with 300 µM C12:0 in the same low-serum medium for indicated times. B, C: RAW 264.7 cells were serum-starved as in A. The cells were then pretreated with indicated concentrations of DHA for 1 h followed by coincubation with 300 µM C12:0 for 15 min (B) or 100 µM C12:0 for 18 h (C). (D) THP-1 cells were serum-starved in 0.25% FBS/RPMI1640 medium for 12 h and then treated with 150 µM C16:0 in the same low-serum medium for indicated times. Protein lysates from A to D were probed for phosphorylated JNK (JNK-p), JNK, phosphorylated ERK (ERK-p), ERK, phosphorylated I κ B α (I κ B α -p), I κ B α , phosphorylated NF κ B p65 (p65-p), NF κ B p65 (p65), COX-2, and β -actin by immunobloting. E, F: THP-1 cells were serum-starved as in D. The cells were then treated with indicated concentrations of C16:0 for 24 h (E) or pretreated with indicated concentrations of DHA for 1 h and then coincubated with 150 µM C16:0 for 24 h (F). The resulting culture medium supernatants were assayed for IL-8 by ELISA. ** P < 0.01: significantly different from vehicle control (E) or from C16:0 alone (F).
Fig. 5.
Fig. 5.
Sodium laurate (C12:0) or BSA-complexed palmitic acid (C16:0-BSA) induced NF κ B activation through TLR2 dimerized with TLR1 or TLR6 and through TLR4. HEK293T cells were cultured in 10% FBS/DMEM medium and cotransfected with TLR2 and TLR1 (A, D), TLR2 and TLR6 (B, E), TLR4 and MD2 (C, F), in addition to NF κ B-luciferase reporter and β –galactosidase expression vectors. After 24 h, the cells were serum-starved in 0.25% FBS/DMEM for 6 h and then treated with C12:0 (A–C) or C16:0-BSA (D–F) for 12 h. The cell lysates were assayed for luciferase and galactosidase activities. Values are expressed as RLA (relative luciferase activity). Controls: Pam (PamCSK4, TLR2/1 agonist, 10 ng/ml), MALP-2 (TLR2/6 agonist, 10 ng/ml), LPS (TLR4 agonist, 50 ng/ml). pDisplay empty vector was used as negative controls. * P < 0.05, ** P < 0.01: significantly different from vehicle control (A–C) or from 50 µM BSA (D–F).
Fig. 6.
Fig. 6.
Sodium laurate (C12:0)-, C16:0-BSA-, or TLR agonist-induced COX-2 and TNF- α expression, reactive oxygen species (ROS) production, and phosphorylation of JNK and ERK were enhanced in the culture medium with low FBS (0.25%) compared with those with high FBS (10%). A–C: RAW 264.7 cells were serum-starved in 0.25% FBS/DMEM medium for 6 h and then treated with C12:0 (A, C) or C16:0-BSA (B, C) for 16 h in the same low-serum medium or cultured continuously in 10% FBS/DMEM medium and treated with C12:0 (A, C) or C16:0-BSA (B, C) for 16 h. The protein lysates were probed for COX-2 and β –actin by immunobloting (A, B). The culture medium supernatants from vehicle, LPS, 100 µM C12:0, 50 µM BSA, and 500 µM C16:0-BSA treatments were assayed for TNF- α by ELISA (C). Controls: 0.2 ng/ml LPS, 2 ng/ml Pam3CSK4 (Pam). D: RAW 264.7 cells were cultured in DMEM medium containing 0.25% or 10% FBS for 6 h and then treated with vehicle, 0.2 ng/ml LPS, 100 µM C12:0, 50 µM BSA, or 500 µM C16:0-BSA for 16 h followed by CM-H2DCFDA staining for 30 min. ROS levels were measured by flow cytometry as described in Methods. E: Summary of the relative ROS production by the treatments in D as folds of geometric means. ** P < 0.01: significantly different from the value of 10% FBS for vehicle control, LPS, C12:0, BSA, and C16:0-BSA treatment samples. F: RAW 264.7 cells were serum-starved in 0.25% FBS/DMEM for 6 h and then treated with 300 μ M C12:0 for indicated times or continuously cultured in 10% FBS/DMEM and treated with 300 µM C12:0 for the same time periods. The protein lysates were probed for phosphorylated JNK (JNK-p), JNK, phosphorylated ERK (ERK-p), ERK, and β -actin by immunobloting. Control: 10 ng/ml LPS.
Fig. 6.
Fig. 6.
Sodium laurate (C12:0)-, C16:0-BSA-, or TLR agonist-induced COX-2 and TNF- α expression, reactive oxygen species (ROS) production, and phosphorylation of JNK and ERK were enhanced in the culture medium with low FBS (0.25%) compared with those with high FBS (10%). A–C: RAW 264.7 cells were serum-starved in 0.25% FBS/DMEM medium for 6 h and then treated with C12:0 (A, C) or C16:0-BSA (B, C) for 16 h in the same low-serum medium or cultured continuously in 10% FBS/DMEM medium and treated with C12:0 (A, C) or C16:0-BSA (B, C) for 16 h. The protein lysates were probed for COX-2 and β –actin by immunobloting (A, B). The culture medium supernatants from vehicle, LPS, 100 µM C12:0, 50 µM BSA, and 500 µM C16:0-BSA treatments were assayed for TNF- α by ELISA (C). Controls: 0.2 ng/ml LPS, 2 ng/ml Pam3CSK4 (Pam). D: RAW 264.7 cells were cultured in DMEM medium containing 0.25% or 10% FBS for 6 h and then treated with vehicle, 0.2 ng/ml LPS, 100 µM C12:0, 50 µM BSA, or 500 µM C16:0-BSA for 16 h followed by CM-H2DCFDA staining for 30 min. ROS levels were measured by flow cytometry as described in Methods. E: Summary of the relative ROS production by the treatments in D as folds of geometric means. ** P < 0.01: significantly different from the value of 10% FBS for vehicle control, LPS, C12:0, BSA, and C16:0-BSA treatment samples. F: RAW 264.7 cells were serum-starved in 0.25% FBS/DMEM for 6 h and then treated with 300 μ M C12:0 for indicated times or continuously cultured in 10% FBS/DMEM and treated with 300 µM C12:0 for the same time periods. The protein lysates were probed for phosphorylated JNK (JNK-p), JNK, phosphorylated ERK (ERK-p), ERK, and β -actin by immunobloting. Control: 10 ng/ml LPS.
Fig. 7.
Fig. 7.
Sodium laurate (C12:0)- or C16:0-BSA-induced JNK or ERK phosphorylation, and COX-2 or TNF- α expression in RAW 264.7 cells cultured in the low serum medium were attenuated by NADPH oxidase inhibitor apocynin. A: RAW 264.7 cells were serum-starved in 0.25% FBS/DMEM for 6 h and then treated with 10 µM CM-H2DCFDA for 30 min followed by treatment with vehicle, 100 ng/ml LPS, 150 µM sodium salt C12:0, 500 µM BSA-complexed C16:0 (C16:0-BSA), or equivalent concentration of BSA for 30 min. ROS levels were analyzed by confocal fluorescent imaging as described in Methods. B, C: RAW 264.7 cells were serum-starved in 0.25% FBS/DMEM for 6 h. The cells were then pretreated with indicated concentrations of apocynin (Apo) for 1 h followed by coincubation with 300 µM C12:0 for 15 min. The protein lysates were probed for JNK-p, JNK, ERK-p, ERK, and β -actin by immunobloting. D–G: RAW 264.7 cells were serum-starved as in B, C. The cells were then pretreated with indicated concentrations of apocynin for 1 h followed by coincubation with 150 µM C12:0 (D, F) or 500 µM C16:0-BSA (E, G) in low 0.25% FBS serum medium for 18 h. The protein lysates were probed for COX-2 and β -actin by immunobloting (D, E) and the medium supernatants were assayed for TNF- α by ELISA (F, G). 50 µM BSA was used as a control for BSA-complexed C16:0 (C16:0-BSA). * P < 0.05, ** P < 0.01: significantly different from the C12:0 treated sample without apocynin treatment (F), or C16:0-BSA treated sample without apocynin treatment (G).

References

    1. Hotamisligil G. S., Erbay E. 2008. Nutrient sensing and inflammation in metabolic diseases. Nat. Rev. Immunol. 8: 923–934. - PMC - PubMed
    1. Schroder K., Zhou R., Tschopp J. 2010. The NLRP3 inflammasome: a sensor for metabolic danger? Science. 327: 296–300. - PubMed
    1. Lee J. Y., Zhao L., Hwang D. H. 2010. Modulation of pattern recognition receptor-mediated inflammation and risk of chronic diseases by dietary fatty acids. Nutr. Rev. 68: 38–61. - PubMed
    1. Zhao L., Lee J. Y., Hwang D. H. 2011. Inhibition of pattern recognition receptor-mediated inflammation by bioactive phytochemicals. Nutr. Rev. 69: 310–320. - PMC - PubMed
    1. Glass C. K., Olefsky J. M. 2012. Inflammation and lipid signaling in the etiology of insulin resistance. Cell Metab. 15: 635–645. - PMC - PubMed

Publication types