. 2012 Sep 13;120(11):2269-79.
doi: 10.1182/blood-2012-05-430470. Epub 2012 Jul 5.

Key implication of CD277/butyrophilin-3 (BTN3A) in cellular stress sensing by a major human γδ T-cell subset

Affiliations

Key implication of CD277/butyrophilin-3 (BTN3A) in cellular stress sensing by a major human γδ T-cell subset

Christelle Harly et al. Blood. .

Abstract

Human peripheral Vγ9Vδ2 T cells are activated by phosphorylated metabolites (phosphoagonists [PAg]) of the mammalian mevalonate or the microbial desoxyxylulose-phosphate pathways accumulated by infected or metabolically distressed cells. The underlying mechanisms are unknown. We show that treatment of nonsusceptible target cells with antibody 20.1 against CD277, a member of the extended B7 superfamily related to butyrophilin, mimics PAg-induced Vγ9Vδ2 T-cell activation and that the Vγ9Vδ2 T-cell receptor is implicated in this effect. Vγ9Vδ2 T-cell activation can be abrogated by exposing susceptible cells (tumor and mycobacteria-infected cells, or aminobisphosphonate-treated cells with up-regulated PAg levels) to antibody 103.2 against CD277. CD277 knockdown and domain-shuffling approaches confirm the key implication of the CD277 isoform BTN3A1 in PAg sensing by Vγ9Vδ2 T cells. Fluorescence recovery after photobleaching (FRAP) experiments support a causal link between intracellular PAg accumulation, decreased BTN3A1 membrane mobility, and ensuing Vγ9Vδ2 T-cell activation. This study demonstrates a novel role played by B7-like molecules in human γδ T-cell antigenic activation and paves the way for new strategies to improve the efficiency of immunotherapies using Vγ9Vδ2 T cells.


Conflict of interest statement

Conflict-of-interest disclosure: The authors declare no competing financial interests.

Figures
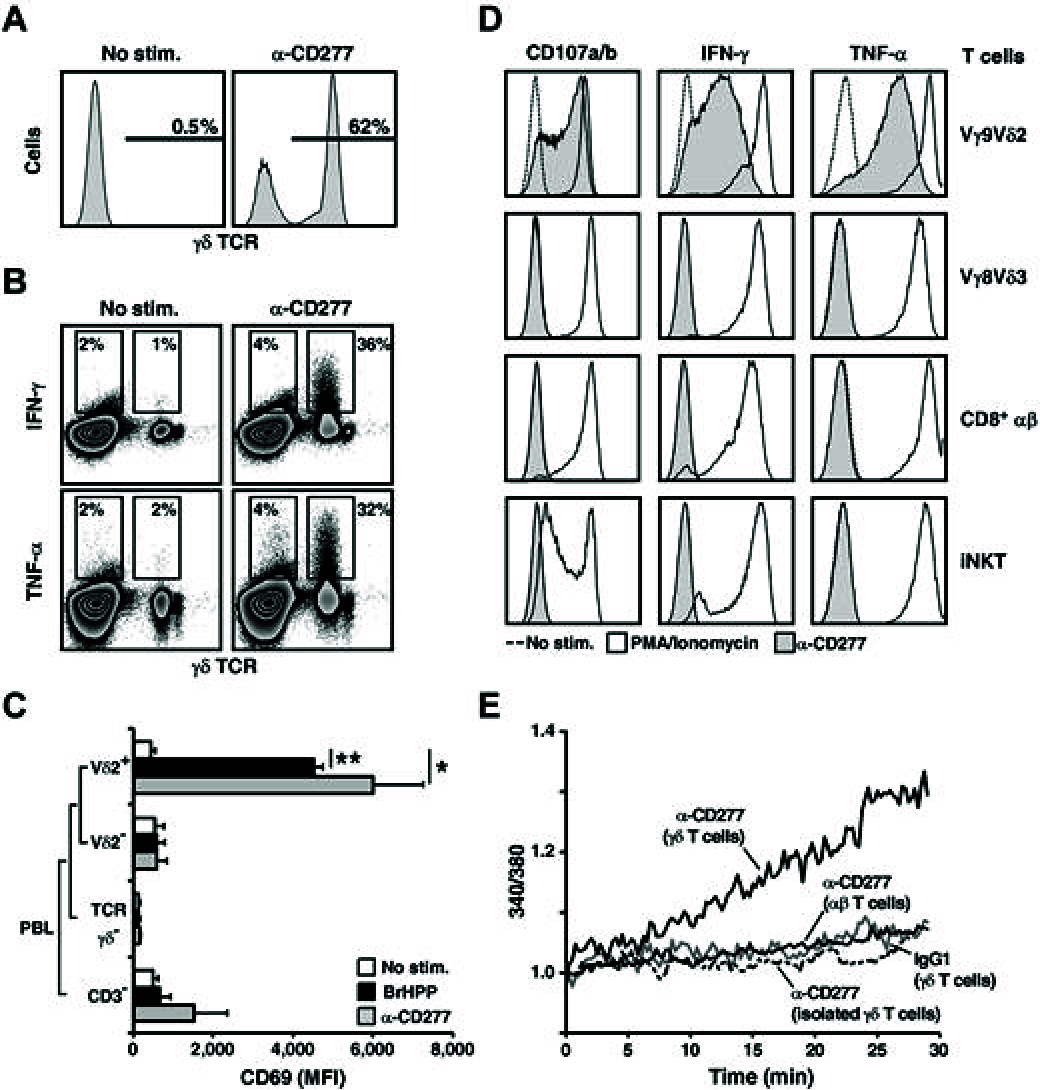
Figure 1
Figure 1
Broad activation of human Vγ9Vδ2 T cells by anti-CD277 mAbs. (A) Frequency of human γδ T cells in IL-2–supplemented ex vivo PBMCs after a 2 week-incubation in the presence of anti-CD277 mAb (#20.1; 10 μg/mL). The values for the percentage of γδ T cells within PBLs are indicated. No stim. indicates no stimulation. (B) Intracellular stainings of IFN-γ and TNF-α in ex vivo human PBL-γδ T cells after incubation for 5 hours with anti-CD277 mAb (#20.1; 10 μg/mL). Numbers inside or adjacent to outlined areas indicate the values for the percentage of IFN-γ+ (top row) or TNF-α+ (bottom row) cells within γδ and γδ+ PBL subsets. (C) Expression of CD69 on ex vivo human PBL subsets after incubation for 7 hours with either anti-CD277 mAb (#20.1; 10 μg/mL) or soluble PAg (BrHPP; 3μM). MFI indicates geometric mean of fluorescence intensity. Data in graph are mean ± SD (n = 3 healthy donors). *P < .05 (Student t test). **P < .005 (Student t test). (D) Stainings of CD107a/b (left), IFN-γ (middle), and TNF-α (right) of Vγ9Vδ2 (clone GR4), Vγ8Vδ3 (clone 73R9), CD8+ αβ (clone 13), and invariant NK (iNKT, line MAD11) human T cells after treatment with anti-CD277 mAb (#20.1; 10 μg/mL, 5 hours). PMA/Iono. indicates nonspecific activation induced by PMA and ionomycin. (A-B,D) Data are representative of at least 3 experiments. (E) Intracellular Ca2+ levels were measured by videomicroscopy within clusters of Fura-2 AM-loaded polyclonal human Vγ9Vδ2 (γδ) T-cell lines after addition (t = 0 minutes) of anti-CD277 mAb (#20.1; 10 μg/mL) and compared with CD8+ αβ (αβ) or isolated γδ T cells. IgG1 indicates isotype control. Values correspond to the mean of emissions (340/380 nm ratio) measured among all T cells present in the field. γδ, n = 70; αβ, n = 30; isolated γδ, n = 30; and IgG1, n = 30.
Figure 2
Figure 2
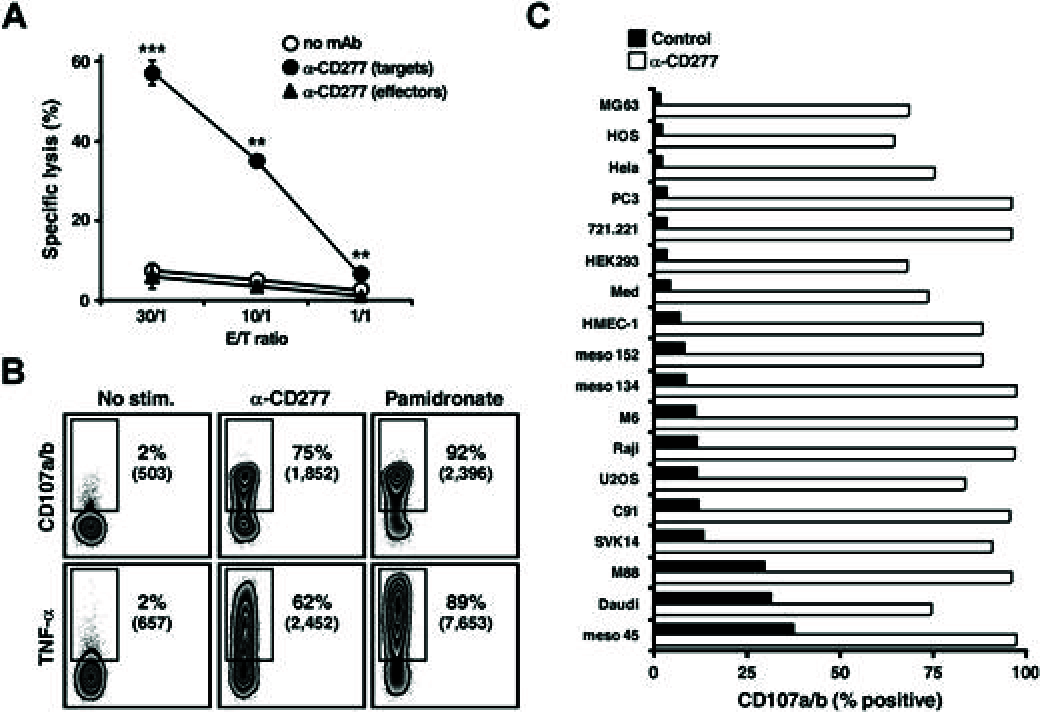
Anti-CD277 mAb induces strong Vγ9Vδ2 T cell cytolytic and cytokine responses. (A) Cytolytic activity of human Vγ9Vδ2 T cells (clone GR4) against Raji Burkitt lymphoma cells. Raji (targets) or Vγ9Vδ2 T (effectors) cells were treated for 2 hours with anti-CD277 mAb (#20.1; 10 μg/mL), washed, and cocultured at the indicated γδ T cell-to-target (E:T) ratios. Data are mean ± SD of triplicate measurements. **P < .005. ***P < .0005. (B) Stainings of CD107a/b (top row; surface) and IFN-γ (bottom row; intracellular) of Vγ9Vδ2 T cells (clone GR4) after coculture with Raji cells, pretreated for 2 hours with either anti-CD277 mAb (#20.1; 10 μg/mL) or NBP (pamidronate; 250μM). Numbers adjacent to outlined areas indicate percent and geometric mean of fluorescence intensity (numbers in brackets) of CD107a/b+ and TNF-α+ T cells. (C) Expression of CD107a/b on Vγ9Vδ2 T cells (clone GR4) after coculture with human tumor/transformed cell lines (n = 18), pretreated for 2 hours with anti-CD277 mAb (#20.1; 10 μg/mL). The values for the percentage of CD107a/b+ Vγ9Vδ2 T cells are represented in the graph. Control indicates no antibody. Data are representative of at least 3 independent experiments.
Figure 3
Figure 3
Vγ9Vδ2 TCR implication in anti-CD277 mAb-induced activation. (A) Confocal microscopy. CD3ε (red) and CD277 (green) distribution in conjugates of Vγ9Vδ2 T cells (line AL) and HEK293 cells expressing EmGFP tagged-CD277 molecules. HEK293 cells were pretreated for 2 hours with anti-CD277 mAb (20.1; 10 μg/mL) and washed before coculture with Vγ9Vδ2 T cells. Composite pictures showing overlays of both colors and bright-field pictures. Confocal images of representative γδ T-cell–HEK293 conjugates are shown. Bars represent 10 μm. (−) indicates untreated cells. One experiment representative of 3 is shown. (B) Surface expression of CD69 on human Jurkat T-cell γδ TCR transductants (human Vγ8Vδ3 or Vγ9Vδ2 TCRs) after incubation for 4 hours with either anti-CD3 (OKT3; 10 μg/mL) or anti-CD277 (20.1; 10 μg/mL) mAbs. WT indicates wild-type Jurkat cells with no TCR expression. The values for the MFI of stained cells are represented in the graph. **P < .005 (Student t test). ***P < .0005 (Student t test). Data are representative of 3 independent experiments. (C) IFN-γ response in PBL-derived human αβ T cells expressing a human Vγ9Vδ2 TCR after incubation with NBP (pamidronate)- or anti-CD277 (20.1; 10 μg/mL) mAb-treated Daudi cells. Production of IFN-γ was determined via ELIspot analysis. Data are mean ± SEM. **P < .005 (2-way ANOVA). ***P < .0005 (2-way ANOVA). Comparable results were obtained in 3 independent experiments. (D-E) IL-2 release by murine T-cell hybridomas, transduced for the expression of a human Vγ9Vδ2 TCR, after coculture with human Raji cells in the presence of anti-CD277 mAb (20.1). (D) IL-2 release by mouse γδTCR58C-CD28+ hydridoma cells. IgG indicates isotype control. Data are representative of 4 independent experiments. *P < .05 (paired Student t test and Mann-Whitney test). (E) IL-2 release by γδTCR53/4-CD28+ (αβ TCR variant) rat/mouse T-cell hybridoma in the presence of Raji cells pretreated with grading doses of anti-CD277 mAb (20.1). Data are mean ± SEM and are representative of 3 independent experiments. *P < .05 (paired Student t test). **P < .005 (paired Student t test). IL-2 production in both panels is presented relative to those of cells cocultured with Raji cells in the absence of antibody with (100%) or without 3mM sec-butylamine (0%).
Figure 4
Figure 4
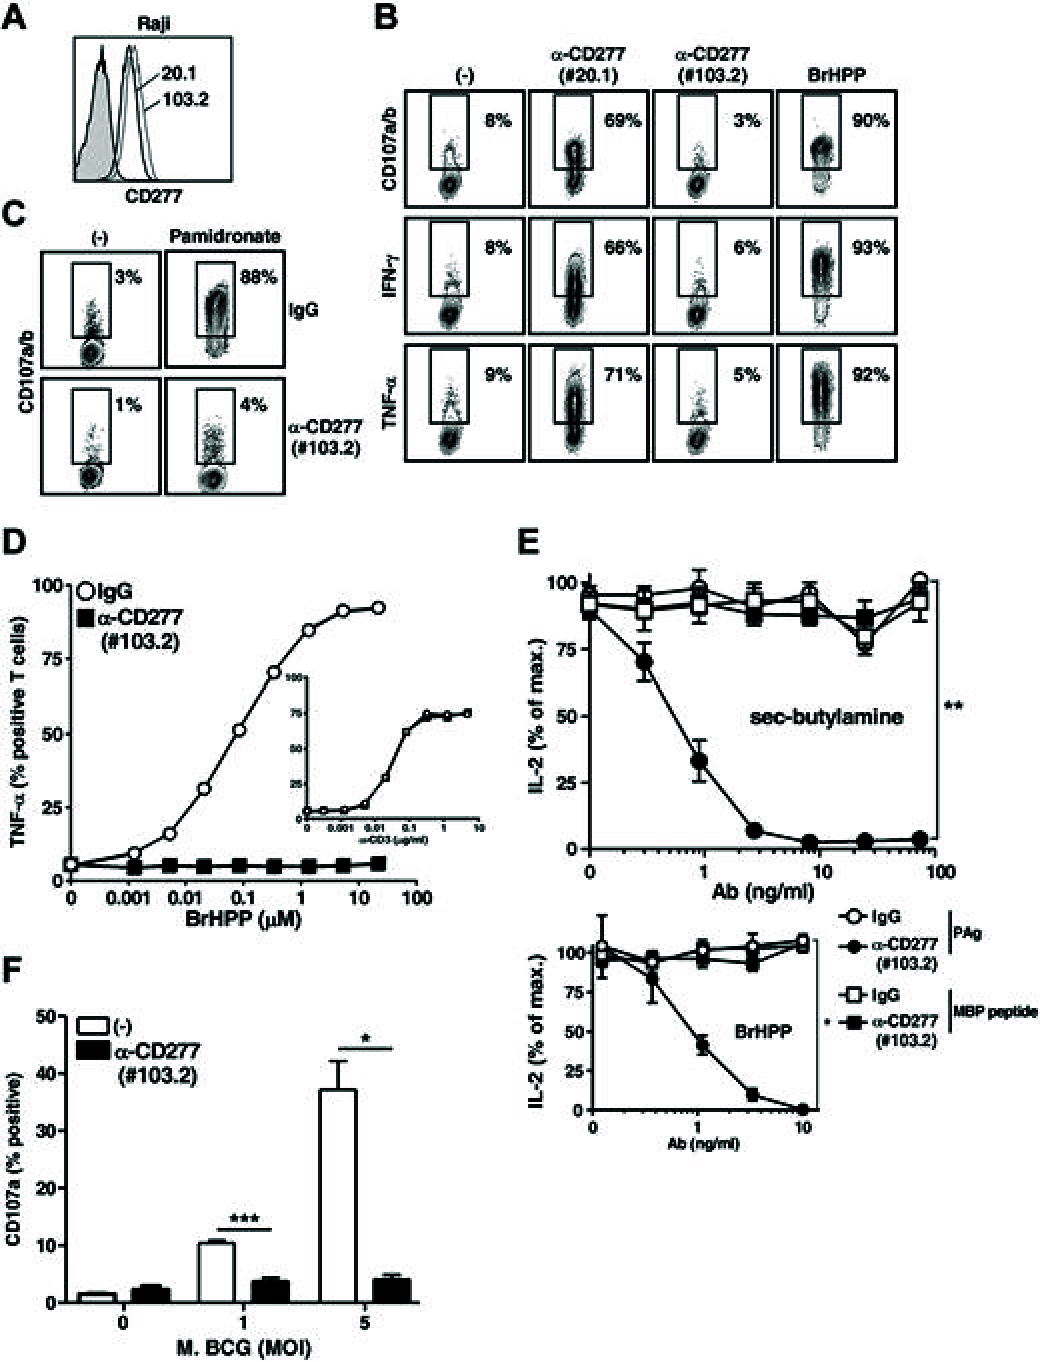
Abrogation of Vγ9Vδ2 T-cell responses by a blocking anti-CD277 mAb. (A) Surface stainings of Raji cells with either 20.1 and 103.2 anti-CD277 mAbs. Filled histogram represents IgG isotype control. (B) Stainings of CD107a/b (top), IFN-γ (middle), and TNF-α (bottom) of Vγ9Vδ2 T cells (clone GR4) after coculture with Raji cells pretreated for 2 hours with either 20.1 or 103.2 anti-CD277 mAbs (10 μg/mL). Numbers adjacent to outlined areas indicate the percentage of CD107a/b+, IFN-γ+, and TNF-α+ γδ T cells. Positive control indicates PAg (BrHPP, 3μM); and (−), no activation. (C) Staining of CD107a/b on Vγ9Vδ2 T cells (line GUI) after coculture with 721.221 B cells, pretreated, or not, for 2 hours with NBP (pamidronate; 250μM). Cocultures were performed in the presence of either control IgG or 103.2 anti-CD277 Abs (10 μg/mL). Numbers adjacent to outlined areas indicate the percentage of CD107a/b+ γδ T cells. (D) TNF-α production by Vγ9Vδ2 T cells (clone GR4) after activation induced by grading doses of soluble PAg (BrHPP) or anti-CD3 mAb (UCHT1, inset) in the presence of control IgG or anti-CD277 (103.2) Abs (10 μg/mL). (E) Top: Effects of grading doses of 103.2 anti-CD277 mAb on IL-2 release by γδTCR53/4-CD28+ hybridoma cells coexpressing both an MBP-specific αβ TCR (RT1Bl/MHC II) and a human Vγ9Vδ2 TCR. Human Raji cells transduced for RT1Bl expression were cocultured with hybridoma T cells in the presence of Guinea pig myelin basic protein peptide (0.1 μg/mL) or sec-butylamine (1mM). Bottom: Activation induced by soluble PAg (BrHPP, 3μM). IgG indicates isotype control. IL-2 production (ELISA) is presented relative to those of cells activated in the absence of antibody. *P < .05 (paired Student t test). **P < .005 (paired Student t test). (F) Expression of CD107a on Vγ9Vδ2 T cells (polyclonal line AL) after coculture with Mycobacterium bovis BCG-infected THP-1 cells, in the presence or in the absence of 103.2 anti-CD277 mAb (10 μg/mL). The values for the percentage of CD107a+ γδ T cells are indicated on the y-axis. MOI indicates multiplicity of infection; and (−), no antibody. Data are mean ± SD (n = 3 experiments). *P < .05 (Student t test). ***P < .0005 (Student t test).
Figure 5
Figure 5
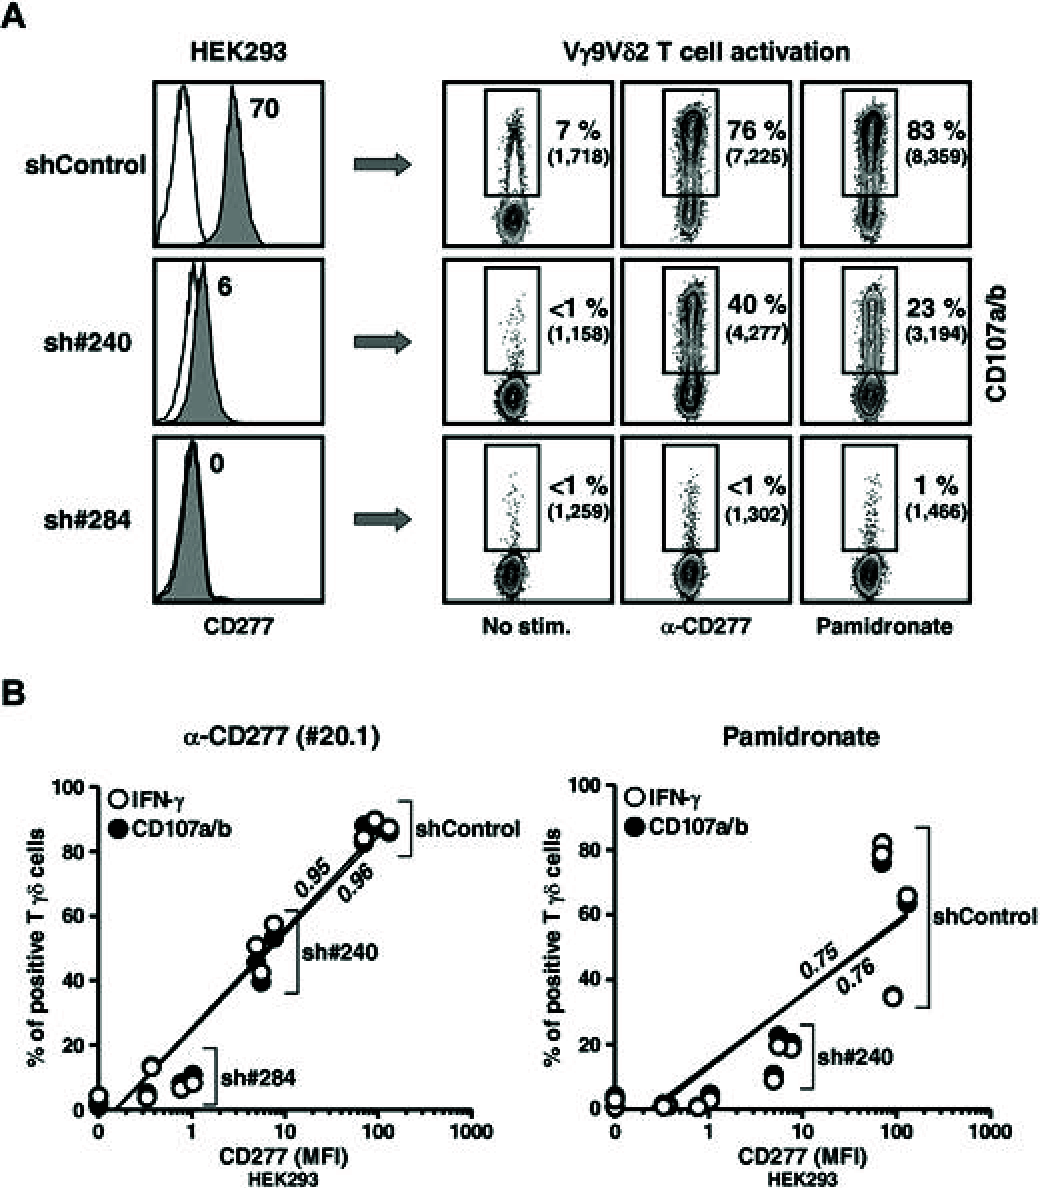
Abrogation of Vγ9Vδ2 T-cell responses by CD277 expression knockdown. (A) Left: Surface expression of CD277 molecules on human HEK293FT clones after transduction with lentivirus delivering irrelevant (shControl) or CD277-specific (sh#240 and sh#284) shRNAs. Open histograms represent control IgG. The value for the intensity of specific CD277 staining (mAb 103.2) is indicated. Right: CD107a/b expression on human Vγ9Vδ2 T cells (line GUI) after coculture with shRNA-transduced HEK293FT clones, pretreated for 2 hours with either anti-CD277 mAb (20.1; 10 μg/mL) or NBP (pamidronate, 100μM). Numbers adjacent to outlined areas indicate the percentage and mean of fluorescence intensity (MFI) of CD107a/b+ T cells. (B) CD107a/b expression and IFN-γ production by Vγ9Vδ2 T cells (line GUI) after incubation with shRNA-transduced HEK293FT clones pretreated for 2 hours with either anti-CD277 mAb (left, 20.1; 10 μg/mL) or NBP (right, pamidronate, 100μM). Data are percentage of CD107a+ (black circles) or IFN-γ+ (white circles) T cells versus the value for the intensity (MFI) of specific CD277 staining (mAb 103.2). sh#284, n = 6; sh#240, n = 3; and shControl, n = 3. Regression lines and calculated r2 values (0.95 and 0.75, for IFN-γ; 0.96 and 0.76 for CD107a/b) are indicated on the graphs.
Figure 6
Figure 6
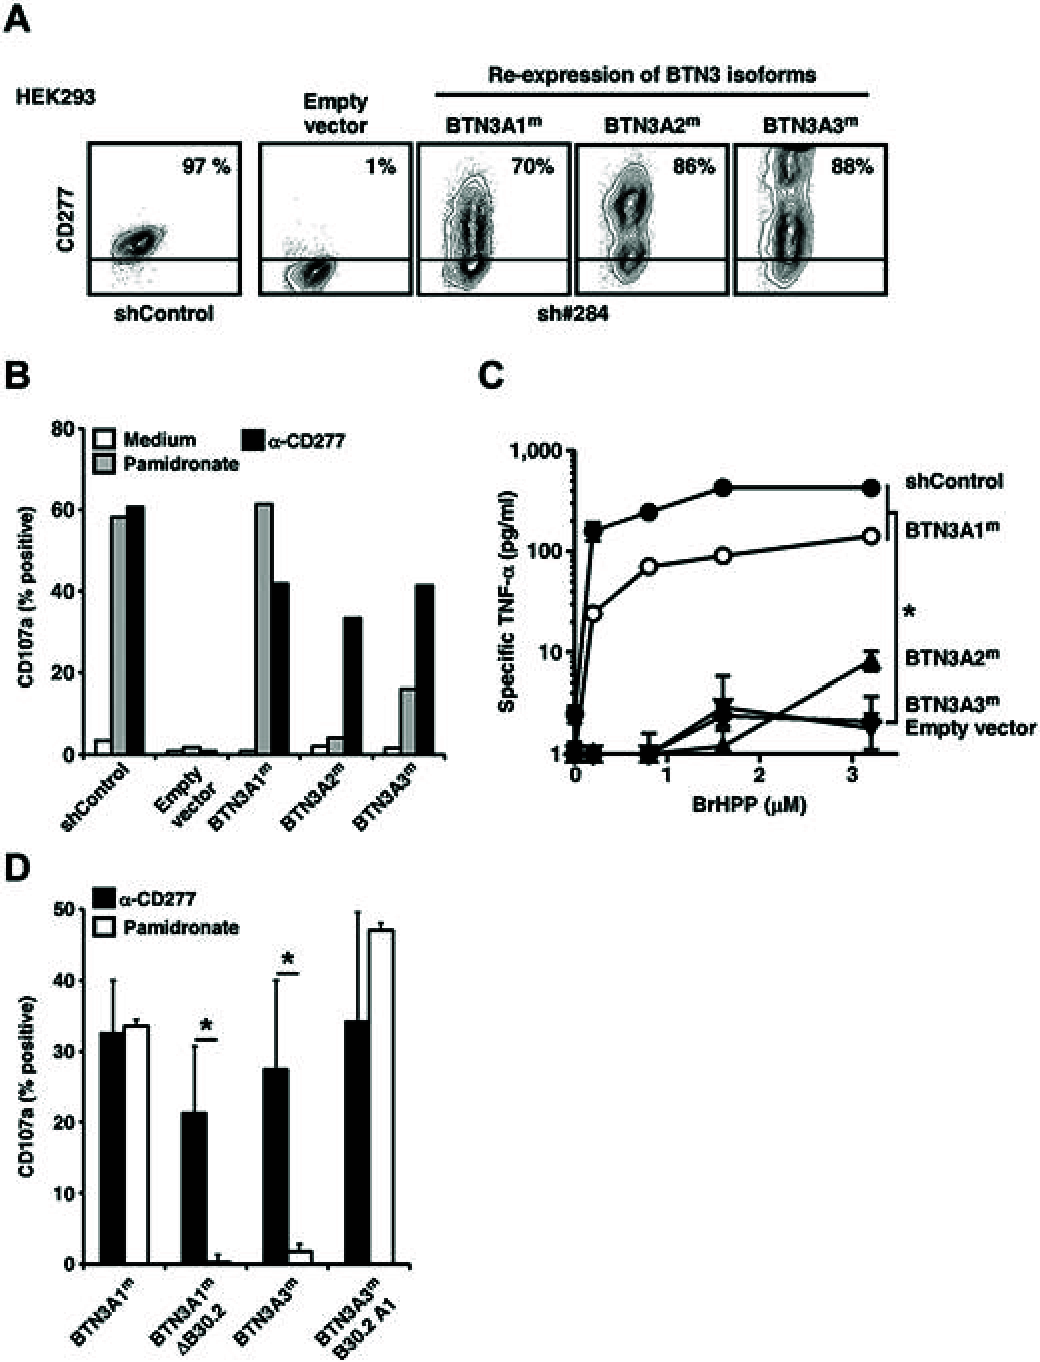
Key role played by BTN3A1 in PAg-induced activation of Vγ9Vδ2 T cells. (A) Surface expression of CD277 molecules on shRNA 284 transduced-HEK293FT cells, knocked down for the expression of endogenous CD277 molecules and selectively re-expressing, after transfection, silently mutated CD277 isoforms (BTN3A1m, BTN3A2m, or BTN3A3m). shControl indicates clone 3, random shRNA sequence; sh#284, shRNA-specific for CD277, clone 30; and empty vector, transfection of an empty plasmid. The values for the percentage of CD277+ cells are indicated. Data are representative of more than 3 independent experiments. (B) Expression of CD107a on Vγ9Vδ2 T cells (line GUI) after coculture with HEK293FT cells re-expressing BTN3A1m, BTN3A2m, or BTN3A3m isoforms and pretreated for 2 hours with NBP (pamidronate, 250μM) or anti-CD277 mAb (20.1, 10 μg/mL). (C) TNF-α release from Vγ9Vδ2 T cells (line GUI) induced by grading doses of soluble PAg (BrHPP) in coculture with HEK293FT cells re-expressing BTN3A1, BTN3A2, or BTN3A3 isoforms. Data are mean ± SD and are representative of 3 independent experiments. *P < .05 (paired Student t test). (D) Expression of CD107a on Vγ9Vδ2 T cells (line AL) after coculture with HEK293FT cells expressing full-length BTN3A1, BTN3A3, truncated BTN3A1 proteins lacking the intracellular B30.2 domain (BTN3A1mΔB30.2), or chimeric BTN3A3 proteins assembled with the BTN3A1 intracellular B30.2 domain (BTN3A3mB30.2A1). Target cells were pretreated for 2 hours with anti-CD277 mAb (20.1, 10 μg/mL) or NBP (pamidronate, 250μM). Data are mean ± SD of the percentage of CD107a+ γδ T cells (n = 3). *P < .05 (Student t test).
Figure 7
Figure 7
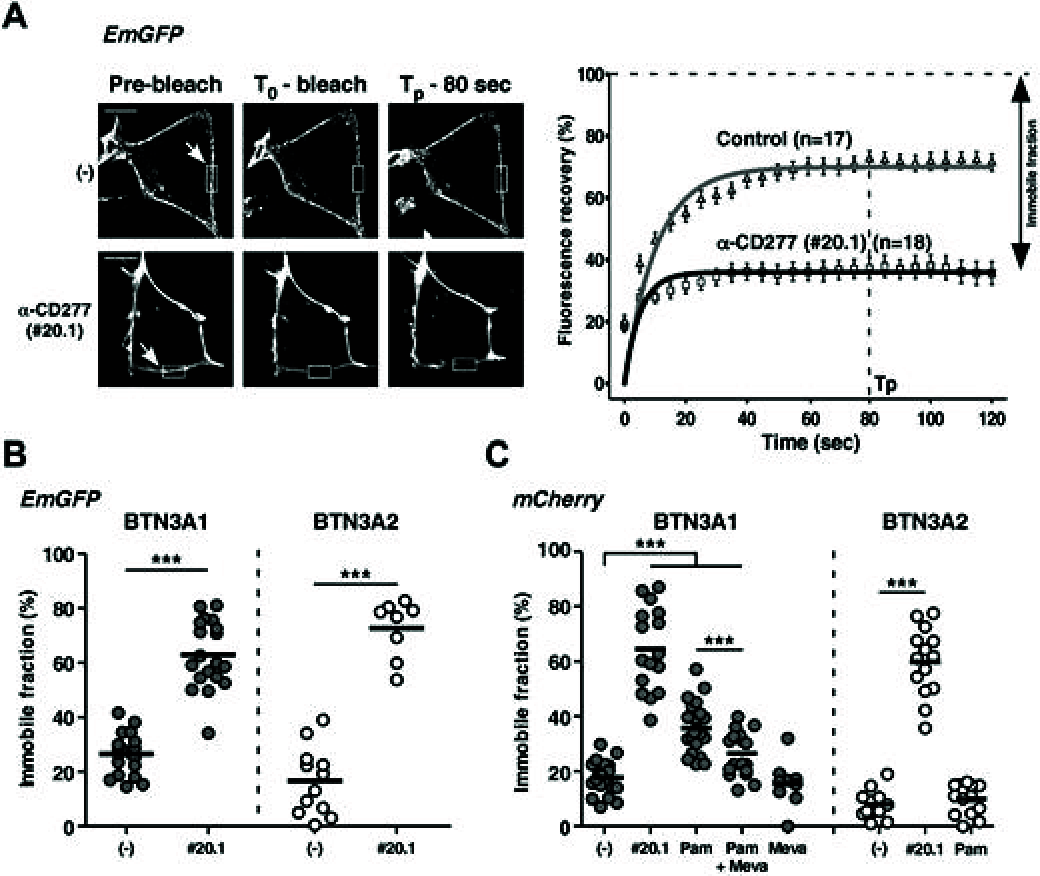
Vγ9Vδ2 T-cell activation correlates with decreased mobility of BTN3A1 induced by agonist anti-CD277 mAb and NBP. (A) Left: Confocal images of HEK293 cells expressing EmGFP-BTN3A1 molecules after incubation for 30 minutes with anti-CD277 mAb (#20.1; 10 μg/mL), shown before (Pre-bleach), immediately after (T0-bleach), and 80 seconds (Tp-80 seconds) after photobleaching of regions of interest (indicated rectangular areas). Scale bars represent 6 μm. (−) indicates no treatment. Right: Mean FRAP and fit curves in EmGFP-BTN3A1-expressing HEK293 cells (n = 18), after treatment with anti-CD277 mAb (#20.1; 10 μg/mL). Control indicates no treatment (n = 17). The symbols correspond to the mean ± SEM of FRAP collected every 5 seconds. The curves were fitted by 1-phase exponential equations. The average fluorescence before photobleaching was counted as 100% (dashed line). Immobile fractions are indicated for each condition. (B) FRAP analysis of HEK293 cells expressing EmGFP-BTN3A1 or EmGFP-BTN3A2 molecules after incubation for 30 minutes with anti-CD277 mAbs (#20.1; 10 μg/mL). Data are presented as the value for the percentage of immobile fraction, measured as described under “Microscopy.” Control indicates no treatment. BTN3A1: (−), n = 21; 20.1, n = 13; BTN3A2: (−), n = 12; 20.1, n = 8. Bars represent mean values. (C) FRAP analysis of HEK293 cells expressing mCherry-BTN3A1 or mCherry-BTN3A2 molecules after either incubation for 30 minutes with anti-CD277 mAb (#20.1; 10 μg/mL), incubation overnight with NBP (Pam; pamidronate; 250μM) or statin (mevastatin, 50μM) only, or treatment with statin for 6 hours before incubation overnight with both statin and NBP (Pam + Meva). Data are presented as the value for the percentage of immobile fraction. Control indicates no treatment. BTN3A1: (−), n = 21; 20.1, n = 16; Pam, n = 28; Pam + Meva, n = 18; Meva, n = 8. BTN3A2: (−), n = 12; 20.1, n = 14; Pam, n = 14. Bars represent mean values. (B-C) ***P < .005 (Student t test).

Comment in

References

    1. Hayday AC. Gammadelta T cells and the lymphoid stress-surveillance response. Immunity. 2009;31(2):184–196. - PubMed
    1. Bonneville M, O'Brien RL, Born WK. Gammadelta T cell effector functions: a blend of innate programming and acquired plasticity. Nat Rev Immunol. 2010;10(7):467–478. - PubMed
    1. Chien YH, Konigshofer Y. Antigen recognition by gammadelta T cells. Immunol Rev. 2007;215:46–58. - PubMed
    1. Fournie JJ, Bonneville M. Stimulation of gamma delta T cells by phosphoantigens. Res Immunol. 1996;147(5):338–347. - PubMed
    1. Bonneville M, Scotet E. Human Vgamma9Vdelta2 T cells: promising new leads for immunotherapy of infections and tumors. Curr Opin Immunol. 2006;18(5):539–546. - PubMed

Publication types

MeSH terms