. 2012 Sep;23(17):3336-47.
doi: 10.1091/mbc.E11-10-0834. Epub 2012 Jul 5.

Cdk1-dependent control of membrane-trafficking dynamics

Affiliations

Cdk1-dependent control of membrane-trafficking dynamics

Derek McCusker et al. Mol Biol Cell. 2012 Sep.

Abstract

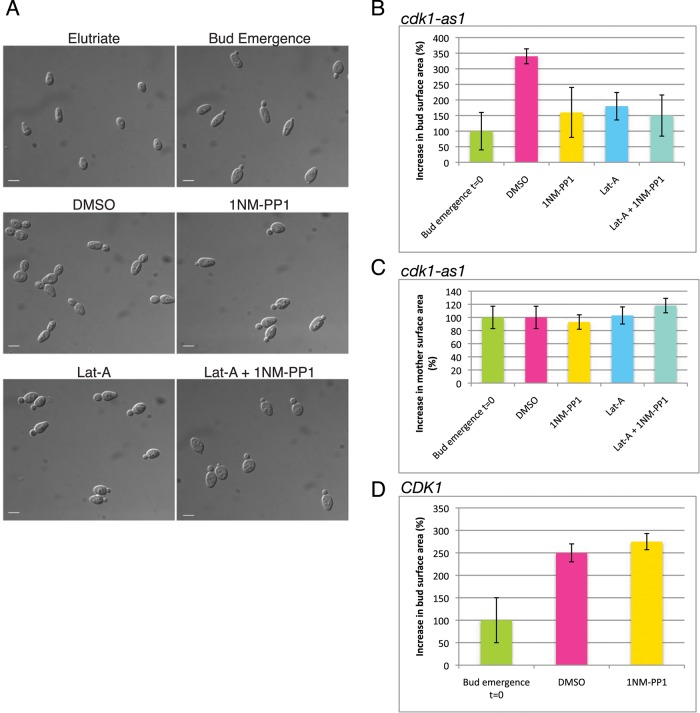
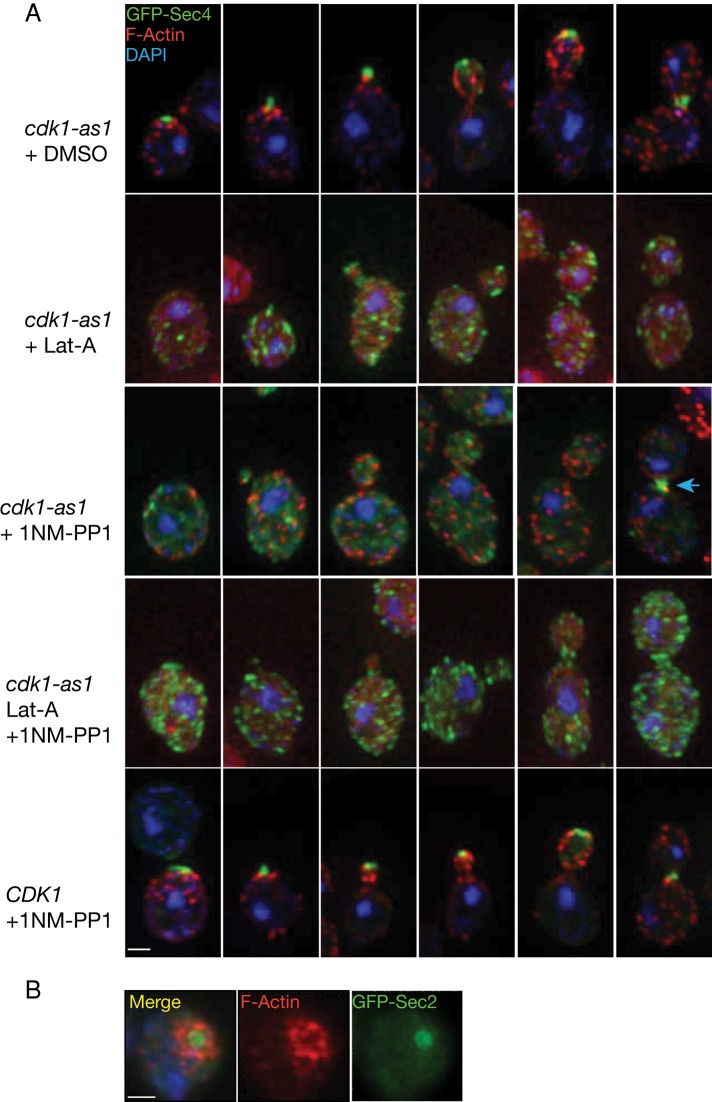
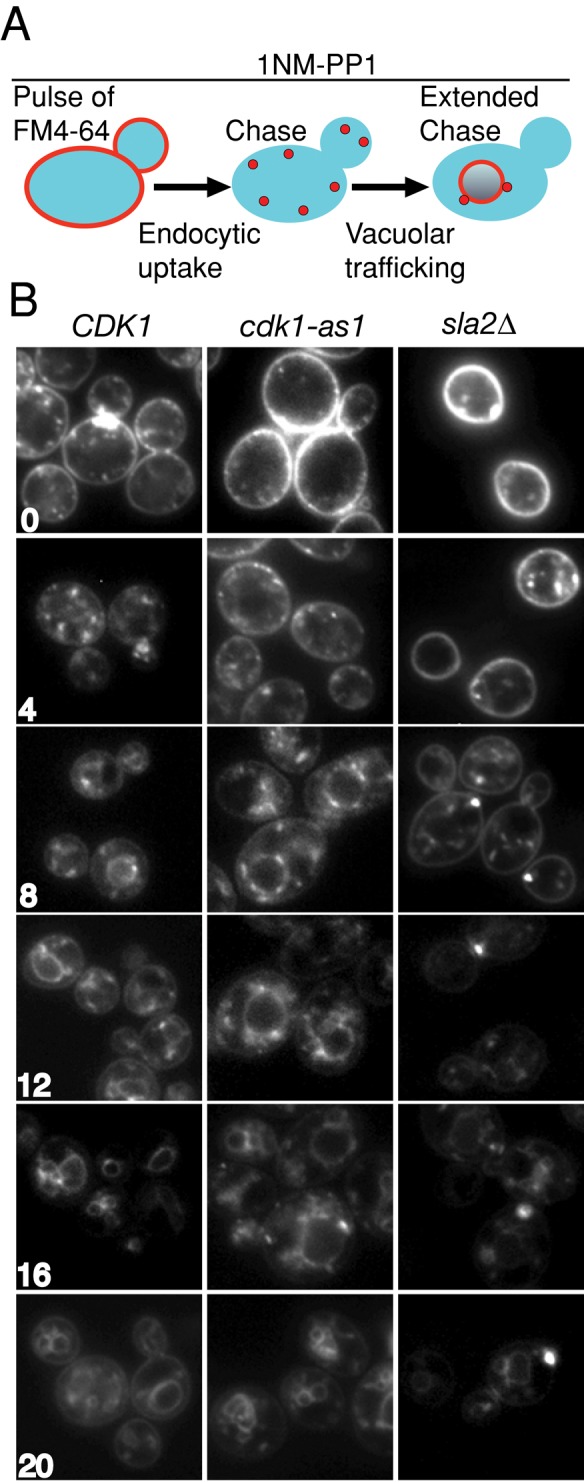
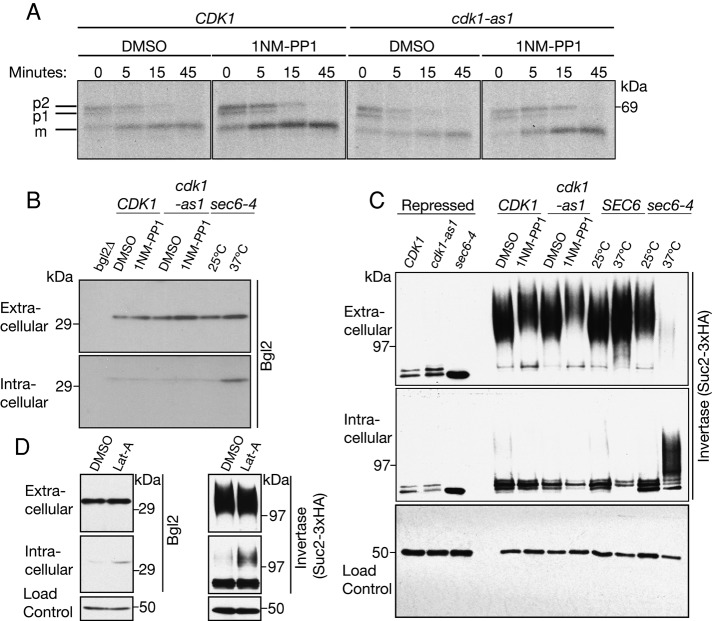
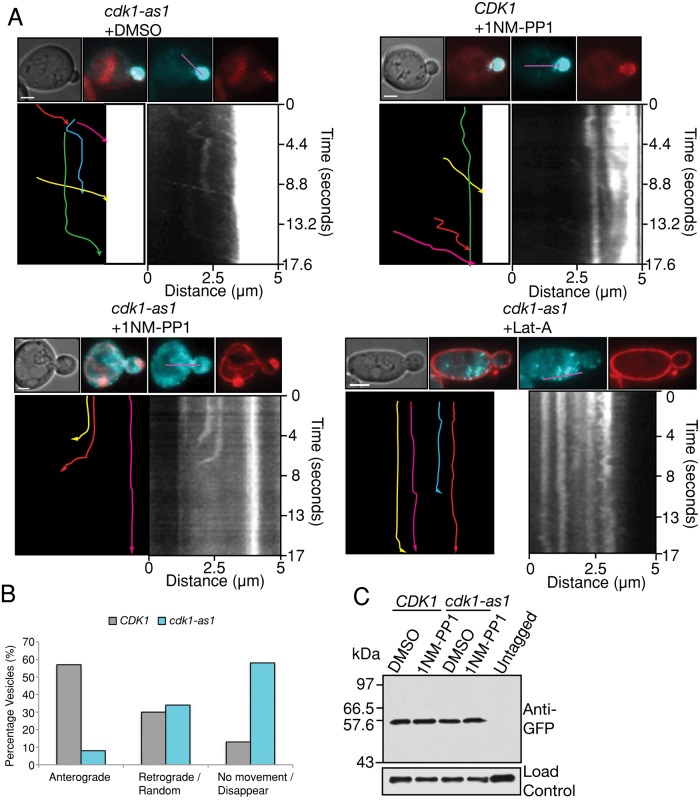
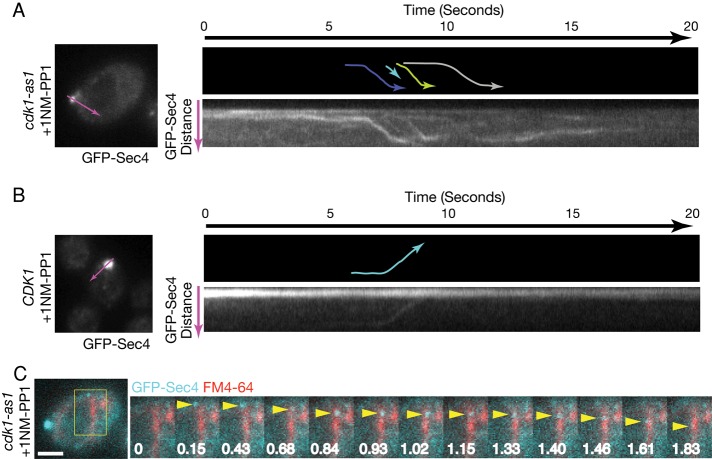
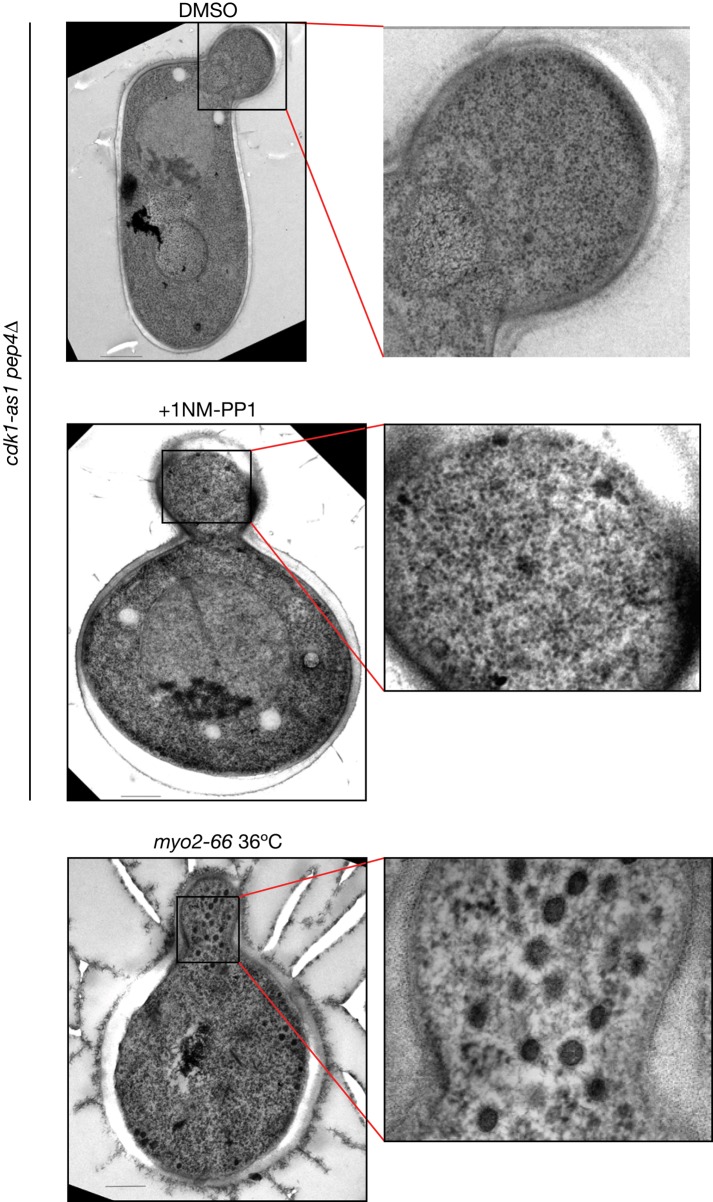
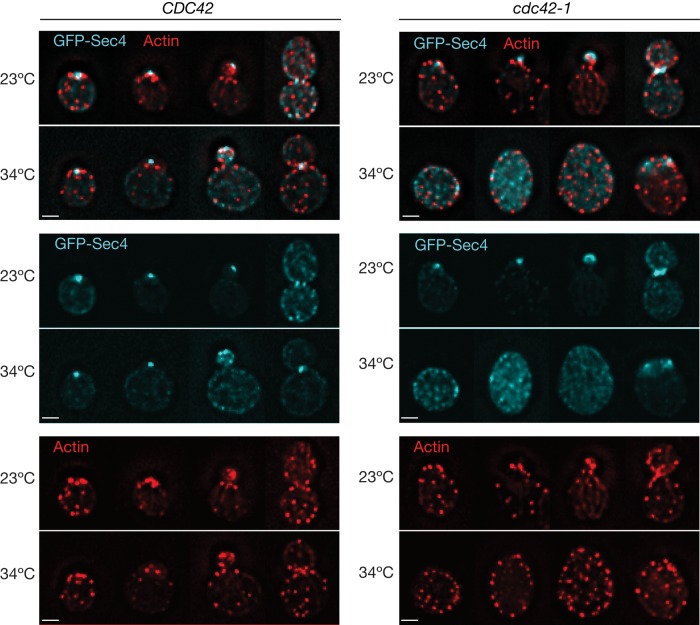
Cyclin-dependent kinase 1 (Cdk1) is required for initiation and maintenance of polarized cell growth in budding yeast. Cdk1 activates Rho-family GTPases, which polarize the actin cytoskeleton for delivery of membrane to growth sites via the secretory pathway. Here we investigate whether Cdk1 plays additional roles in the initiation and maintenance of polarized cell growth. We find that inhibition of Cdk1 causes a cell surface growth defect that is as severe as that caused by actin depolymerization. However, unlike actin depolymerization, Cdk1 inhibition does not result in a massive accumulation of intracellular secretory vesicles or their cargoes. Analysis of post-Golgi vesicle dynamics after Cdk1 inhibition demonstrates that exocytic vesicles are rapidly mistargeted away from the growing bud, possibly to the endomembrane/vacuolar system. Inhibition of Cdk1 also causes defects in the organization of endocytic and exocytic zones at the site of growth. Cdk1 thus modulates membrane-trafficking dynamics, which is likely to play an important role in coordinating cell surface growth with cell cycle progression.


Figures

FIGURE 1:
FIGURE 1:
Inhibition of Cdk1 attenuates bud growth as severely as actin depolymerization. (A) Images showing representative samples of cells. Elutriate: cells immediately after elutriation; Bud Emergence: cells at the time when inhibitors were added. Cells were treated for 1 h with DMSO as a control or with the indicated inhibitors. Scale bar, 5 μm. (B) Quantitation of the surface area of buds in cdk1-as1 cells 1 h after treatment. The bar labeled t = 0 shows the size of buds at the time of inhibitor addition. Absolute bud size at t = 0 was 5 μm2. (C) Quantitation of mother cell surface area in cdk1-as1 cells treated with inhibitors. Absolute mother size at t = 0 was 29 μm2. (D) Quantitation of bud growth in wild-type cells treated with 1NM-PP1 for 1 h. Absolute bud size at t = 0 was 4 μm2. Error bars show mean ± SD, where n is at least 100 cells.
FIGURE 2:
FIGURE 2:
Behavior of GFP-Sec4 and actin after inhibition of Cdk1. (A) Asynchronous cells were treated for 1 h with DMSO or with the indicated inhibitors and were then fixed and stained. Images show maximum projections of 15–20 deconvolved z-sections through different cells at distinct cell cycle stages. GFP-Sec4 is shown in green, rhodamine–phalloidin in red, and DNA in blue. An arrow denotes the Cdk1-independent localization of GFP-Sec4 to the bud neck postanaphase. Scale bar, 2 μm. (B) Wide-field fluorescence images showing the top view of an unbudded cell initiating polarization of Sec2-GFP (green), F-actin (red), and DNA (blue). Scale bar, 2 μm.
FIGURE 3:
FIGURE 3:
Cdk1 activity is not required for endocytosis. (A) Schematic representation of the experiment. CDK1 and cdk1-as1 cells were treated for 1 h with 1NM-PP1 and compared with an endocytosis-defective sla2Δ control in the following experiment: endocytosis was blocked by placing cells on ice, then a pulse of the lipophilic dye FM4-64 was provided, followed by a chase period in the absence of dye. During the chase, the dye is internalized by endocytosis, transits the endocytic pathway, and is delivered to the vacuole in the presence of 1NM-PP1. (B) Wide-field fluorescence images showing FM4-64 staining in live cells. Numbers indicate the time, in minutes, after initiation of the chase. In the endocytosis-defective sla2Δ mutant, FM4-64 accumulates in punctate intracellular structures, and the kinetics of its delivery to the vacuole is delayed.
FIGURE 4:
FIGURE 4:
Cdk1 inhibition does not result in the intracellular accumulation of post-Golgi vesicle cargoes. (A) CDK1 and cdk1-as1 cells were treated with 1NM-PP1 or DMSO control. Cells were then pulsed with 35S-methionine for 10 min and chased for the times indicated. CPY was immunoprecipitated and analyzed by SDS–PAGE. (B) Immunoblot analysis of the extracellular and intracellular pools of the post-Golgi vesicle cargo protein Bgl2. Note that inactivation of sec6-4 caused an increase in intracellular levels of Bgl2. Nap1 was used as a loading control (not shown). (C) Immunoblot analysis of the extracellular and intracellular levels of Suc2-3xHA. Cells were grown in 2% glucose containing 1NM-PP1 or DMSO control for 1 h. Suc2-3xHA was then induced by shifting cells to 0.1% glucose in the presence of 1NM-PP1 or DMSO and harvesting cells after an additional hour. Note that inactivation of sec6-4 caused a complete block in secretion of Suc2-3xHA. Nap1 was used as a loading control. (D) Immunoblot analysis of the secreted and intracellular pools of Bgl2 and Suc2-3xHA levels after actin depolymerization for 1 h using latrunculin-A. Nap1 was used as a loading control. Note that the data presented in C and D were obtained in separate experiments.
FIGURE 5:
FIGURE 5:
Cdk1 inhibition results in aberrant targeting of post-Golgi vesicles. (A) Cells of the indicated genotypes were treated with 1NM-PP1 or Lat-A for 1 h and pulse chased with FM4-64 to label the vacuole. From 80 to 100 images were then acquired at 220-ms intervals and stacked vertically to generate kymographs. In each set, shown at the top are a differential interference contrast image, merged images of GFP-Sec4 (cyan) and FM4-64 (red), and the individual images used to generate the merge. The longitudinal line used to generate kymographs is shown in purple. Lower right, the resulting kymograph; lower left, a tracing of the kymograph in which each colored line represents the trajectory of a different GFP-Sec4 particle, with the arrowhead showing the direction of movement. Scale bar, 2 μm. (B) Quantitation of vesicle behavior. n = 282 vesicles for CDK1 and n = 671 vesicles for cdk1-as1. (C) Levels of GFP-Sec4 after 1 h of treatment with 1NM-PP1 or DMSO. Nap1 was used as a loading control.
FIGURE 6:
FIGURE 6:
Retrograde streaming of post-Golgi particles from sites of polarized growth into the mother cell after cdk1-as1 inhibition. (A) cdk1-as1 cells or (B) CDK1 cells were treated with 1NM-PP1 for 20 min and imaged. Approximately 650 images were acquired at 30-ms intervals and stacked vertically to generate kymographs. In each set of images, shown at the top is a schematic representation of the kymograph in which the colored lines indicate individual particle trajectories and the arrow indicates the direction of movement. The longitudinal line used to generate kymographs is shown in purple on an image of the cell used for imaging. (C) A series of images from the cdk1-as1 cell shown in A, where a GFP-Sec4 particle (indicated by a yellow arrowhead) moves to the vacuolar membrane (shown in red after staining with FM4-64) and then disappears. Time is shown in seconds. Scale bar, 2 μm.
FIGURE 7:
FIGURE 7:
Accumulation of cytoplasmic vesicles after inactivation of myo2-66 but not after cdk1-as1 inhibition. Cells were grown to early-log phase and treated for 1 h with DMSO as a control, with 1NM-PP1 to inactivate cdk1-as1, or shifted to 36ºC for 1 h to inactivate myo2-66. After rapid freezing, cells were freeze substituted and processed for transmission electron microscopy. Scale bar, 200 nm.
FIGURE 8:
FIGURE 8:
Accumulation of cytoplasmic GFP-Sec4 in cdc42-1 mutant cells. Cells expressing GFP-Sec4 (cyan) were shifted to the temperature indicated and fixed after 3 h. The actin cytoskeleton (red) was stained with Alexa 546–phalloidin. Images show maximum projections of 15–20 deconvolved z-sections through different cells at distinct cell cycle stages. Shown are individual GFP-Sec4 and actin channels and the merge of the two signals. Scale bar, 2 μm.

Similar articles

Cited by

References

    1. Adamo JE, Moskow JJ, Gladfelter AS, Viterbo D, Lew DJ, Brennwald PJ. Yeast Cdc42 functions at a late step in exocytosis, specifically during polarized growth of the emerging bud. J Cell Biol. 2001;155:581–592. - PMC - PubMed
    1. Adams AE, Johnson DI, Longnecker RM, Sloat BF, Pringle JR. CDC42 and CDC43, two additional genes involved in budding and the establishment of cell polarity in the yeast Saccharomyces cerevisiae. J Cell Biol. 1990;111:131–142. - PMC - PubMed
    1. Amberg DC. Three-dimensional imaging of the yeast actin cytoskeleton through the budding cell cycle. Mol Biol Cell. 1998;9:3259–3262. - PMC - PubMed
    1. Ayscough KR, Stryker J, Pokala N, Sanders M, Crews P, Drubin DG. High rates of actin filament turnover in budding yeast and roles for actin in establishment and maintenance of cell polarity revealed using the actin inhibitor latrunculin-A. J Cell Biol. 1997;137:399–416. - PMC - PubMed
    1. Bishop AC, Buzko O, Shokat KM. Magic bullets for protein kinases. Trends Cell Biol. 2001;11:167–172. - PubMed

Publication types

MeSH terms

Substances