. 2012;7(6):e39341.
doi: 10.1371/journal.pone.0039341. Epub 2012 Jun 29.

Dietary differentiation and the evolution of population genetic structure in a highly mobile carnivore

Affiliations

Dietary differentiation and the evolution of population genetic structure in a highly mobile carnivore

Małgorzata Pilot et al. PLoS One. 2012.

Abstract

Recent studies on highly mobile carnivores revealed cryptic population genetic structures correlated to transitions in habitat types and prey species composition. This led to the hypothesis that natal-habitat-biased dispersal may be responsible for generating population genetic structure. However, direct evidence for the concordant ecological and genetic differentiation between populations of highly mobile mammals is rare. To address this we analyzed stable isotope profiles (δ(13)C and δ(15)N values) for Eastern European wolves (Canis lupus) as a quantifiable proxy measure of diet for individuals that had been genotyped in an earlier study (showing cryptic genetic structure), to provide a quantitative assessment of the relationship between individual foraging behavior and genotype. We found a significant correlation between genetic distances and dietary differentiation (explaining 46% of the variation) in both the marginal test and crucially, when geographic distance was accounted for as a co-variable. These results, interpreted in the context of other possible mechanisms such as allopatry and isolation by distance, reinforce earlier studies suggesting that diet and associated habitat choice are influencing the structuring of populations in highly mobile carnivores.


Conflict of interest statement

Competing Interests: The authors have declared that no competing interests exist.

Figures

Figure 1
Figure 1. Geographic distribution of the grey wolf samples used in the stable isotope analysis.
One point represents an individual or a group of individuals sampled in the same location, and large circles represent geographical regions the samples were grouped into. The samples were assigned to subpopulations delimited based on allele frequencies at 14 microsatellite loci (NUC 1 and NUC2), and frequencies of mtDNA haplotypes (MIT1-MIT4) based on the analysis of a larger dataset in Pilot et al. . Dashed line represents the approximate border between two habitats: temperate mixed forest and forest-steppe.
Figure 2
Figure 2. IsoSource dietary mixing polygon for Eastern European grey wolves.
The wolf δ 13C and δ 15N values are plotted with potential prey. Trophic enrichment values of 1.3‰ for δ 13C and 4.6‰ for δ 15N were added to the mean δ 13C and δ 15N values of potential prey. Stable isotope profiles are presented as mean and standard deviation for: (A) The entire wolf population. Contribution of each prey species to the diet is reported as the 25th to 75th percentile ranges of the estimated feasible distributions; (B) Subpopulations delimited based on microsatellite loci (NUC 1 and 2); (C) Subpopulations delimited based on mtDNA (MIT 1-4); (D) All analyzed individuals. Subpopulation MIT4 was represented by only one individual, and it was excluded from DISTLM analysis (see Materials and Methods). For standard deviation of prey stable isotope profiles, see Figure S2.
Figure 3
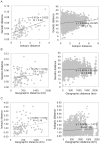
Figure 3. Graphical illustration of correlations between genetic and dietary differentiation and geographic distance.
Correlations are presented at a population (left) and individual (right) level. (A) The correlation between genetic and stable isotope differentiation. Genetic distances between populations were represented by pairwise F ST values. Genetic distances between individuals were calculated using a method implemented in GenAlEx. Isotopic distances between populations and individuals were calculated by treating δ 13C and δ 15N values as two-dimensional Cartesian coordinates. Both correlations are significant (see Results). (B) The correlation between genetic and geographic distances. Only the correlation at individual level is significant (P = 0.04). (C) Correlation between stable isotope differentiation and geographic distances. Subpopulation MIT4 was represented by only one individual, and it was excluded from the population-level analysis.

Similar articles

Cited by

References

    1. Rueness EK, Stenseth NC, O’Donoghue M, Boutin S, Ellegren H, Jakobsen KS. Ecological and genetic spatial structuring in the Canadian lynx. Nature. 2003;425:69–72. - PubMed
    1. Stenseth NC, Shabbar A, Chan K-S, Boutin S, Rueness EK, et al. Snow conditions may create an invisible barrier for lynx. Proc Natl Acad Sci USA. 2004;101:10632–10634. - PMC - PubMed
    1. Geffen E, Anderson MJ, Wayne RK. Climate and habitat barriers to dispersal in the highly mobile grey wolf. Mol Ecol. 2004;13:2481–2490. - PubMed
    1. Dalén L, Fuglei E, Hersteinsson P, Kapel CMO, Roth JD, et al. Population history and genetic structure of a circumpolar species: the arctic fox. Biol J Linn Soc. 2005;84:79–89.
    1. Sacks BN, Mitchell BR, Williams CR, Ernest HB. Coyote movements and social structure along a cryptic population genetic subdivision. Mol Ecol. 2005;14:1241–1249. - PubMed

Publication types