

Localization and functional characterization of the rat Oatp4c1 transporter in an in vitro cell system and rat tissues
- PMID: 22768102
- PMCID: PMC3387246
- DOI: 10.1371/journal.pone.0039641
Localization and functional characterization of the rat Oatp4c1 transporter in an in vitro cell system and rat tissues
Abstract
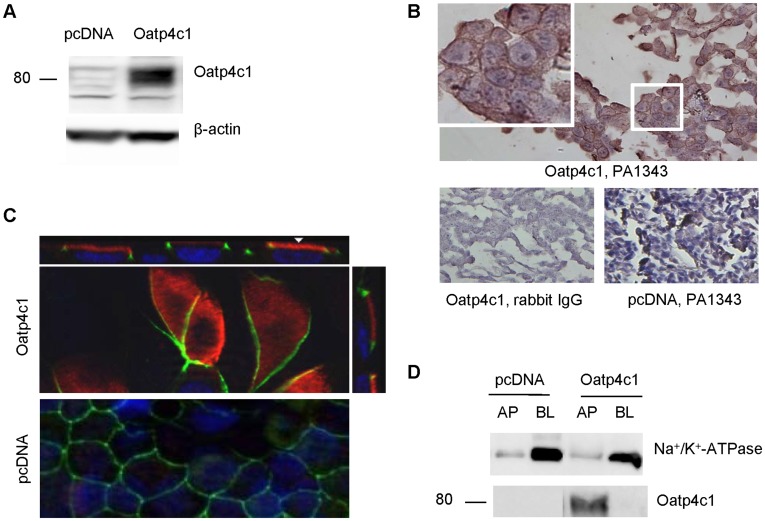
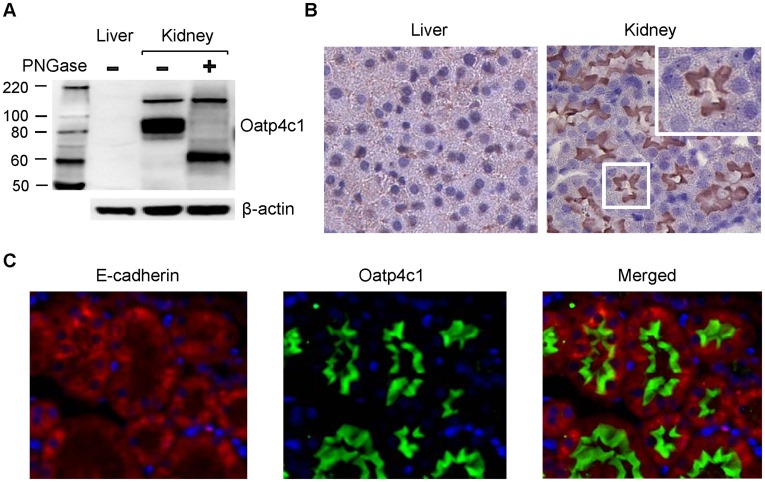
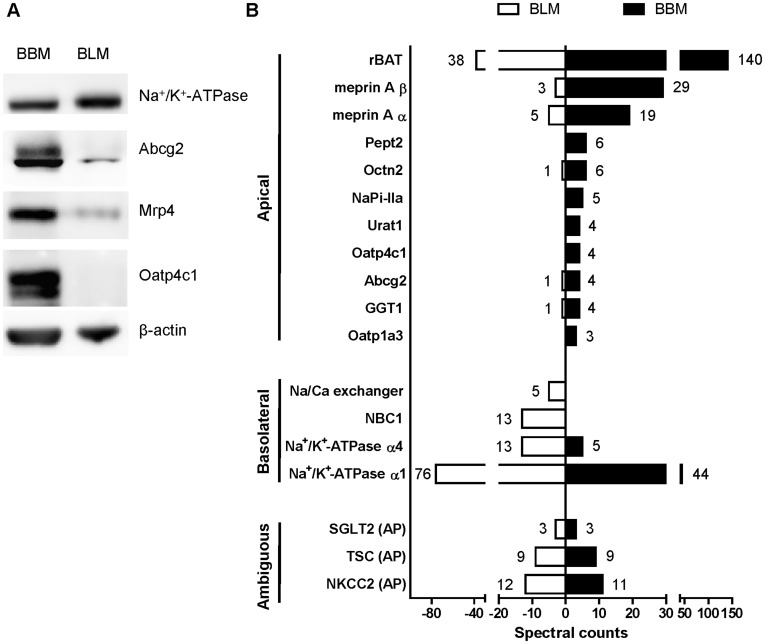
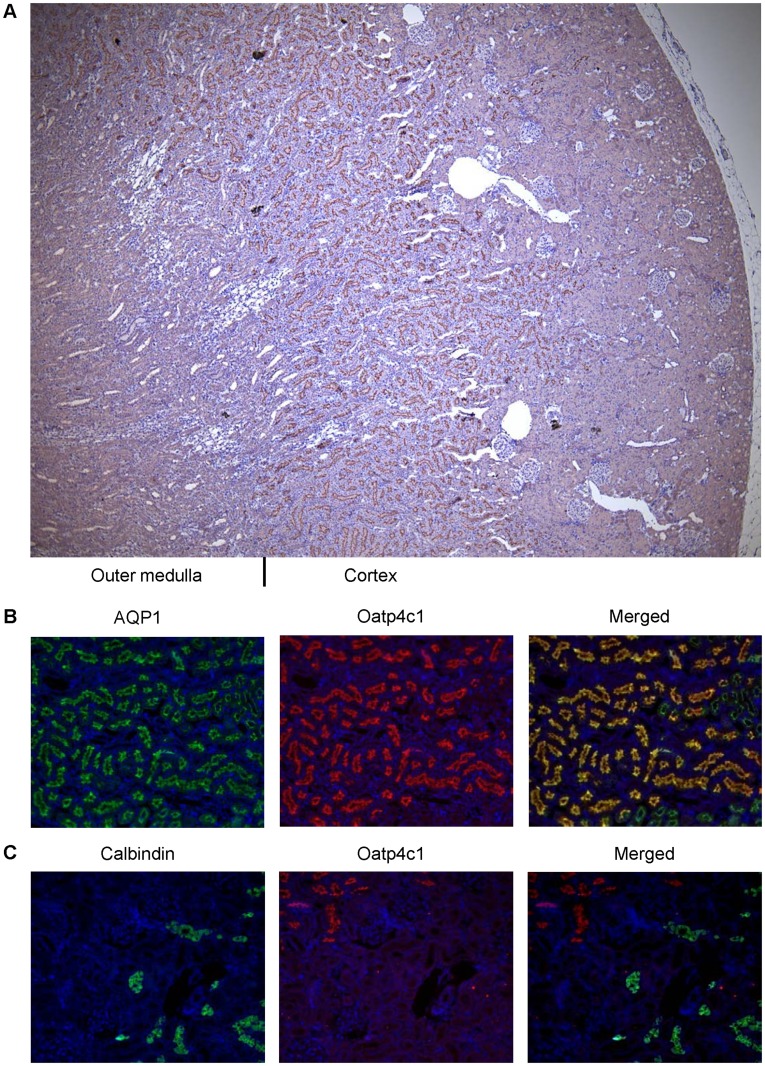
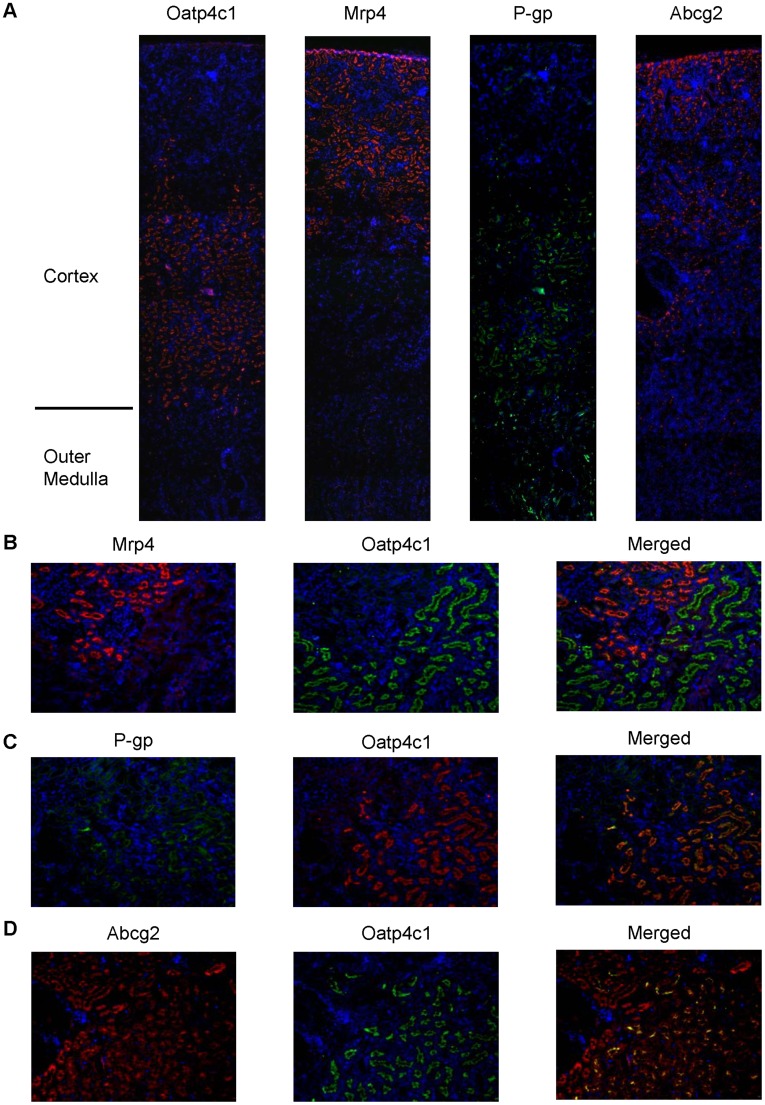
The organic anion transporting polypeptide 4c1 (Oatp4c1) was previously identified as a novel uptake transporter predominantly expressed at the basolateral membrane in the rat kidney proximal tubules. Its functional role was suggested to be a vectorial transport partner of an apically-expressed efflux transporter for the efficient translocation of physiological substrates into urine, some of which were suggested to be uremic toxins. However, our in vitro studies with MDCKII cells showed that upon transfection rat Oatp4c1 polarizes to the apical membrane. In this report, we validated the trafficking and function of Oatp4c1 in polarized cell systems as well as its subcellular localization in rat kidney. Using several complementary biochemical, molecular and proteomic methods as well as antibodies amenable to immunohistochemistry, immunofluorescence, and immunobloting we investigated the expression pattern of Oatp4c1 in polarized cell systems and in the rat kidney. Collectively, these data demonstrate that rat Oatp4c1 traffics to the apical cell surface of polarized epithelium and localizes primarily in the proximal straight tubules, the S3 fraction of the nephron. Drug uptake studies in Oatp4c1-overexpressing cells demonstrated that Oatp4c1-mediated estrone-3-sulfate (E3S) uptake was pH-dependent and ATP-independent. These data definitively demonstrate the subcellular localization and histological location of Oatp4c1 and provide additional functional evidence that reconciles expression-function reports found in the literature.
Conflict of interest statement
Figures
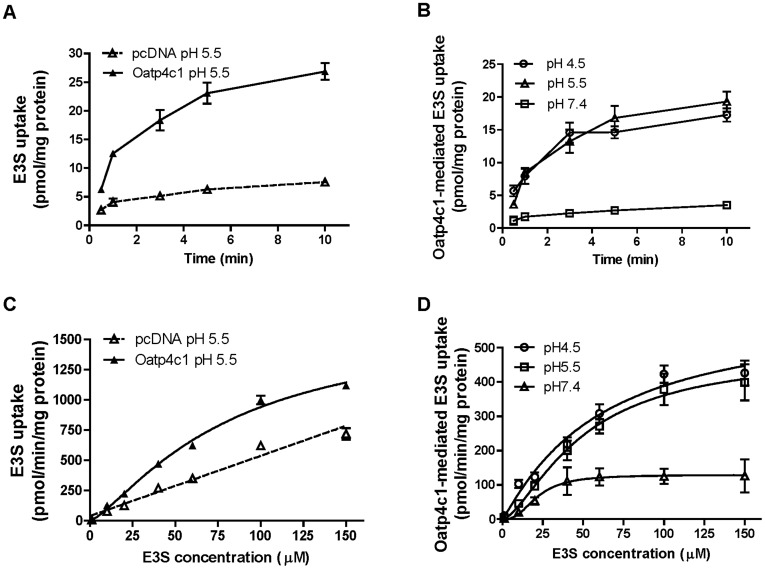
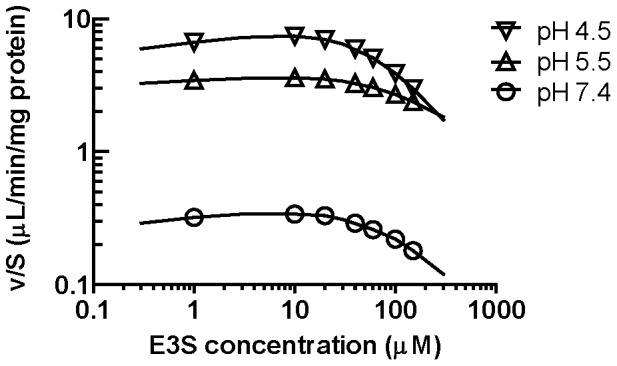
 was estimated using the parameter estimates in Table 1. The solid lines show the best fit to the data using
  obtained from [3H]-E3S uptake (Fig. 6).
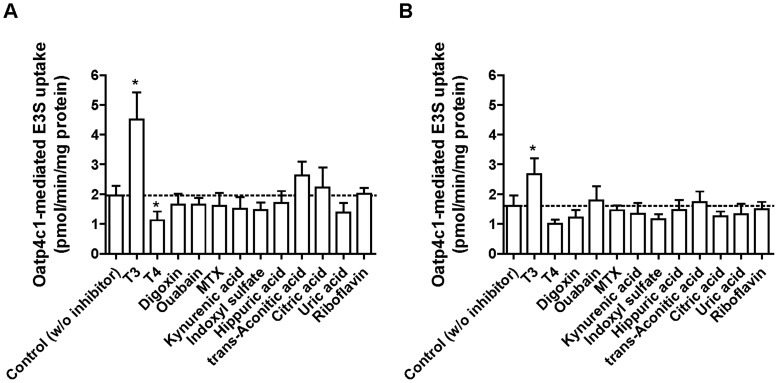
Similar articles
-
Isolation and characterization of a digoxin transporter and its rat homologue expressed in the kidney.Proc Natl Acad Sci U S A. 2004 Mar 9;101(10):3569-74. doi: 10.1073/pnas.0304987101. Epub 2004 Mar 1. Proc Natl Acad Sci U S A. 2004. PMID: 14993604 Free PMC article.
-
Transport of estrone 3-sulfate mediated by organic anion transporter OATP4C1: estrone 3-sulfate binds to the different recognition site for digoxin in OATP4C1.Drug Metab Pharmacokinet. 2010;25(3):314-7. doi: 10.2133/dmpk.25.314. Drug Metab Pharmacokinet. 2010. PMID: 20610891
-
The renal transport protein OATP4C1 mediates uptake of the uremic toxin asymmetric dimethylarginine (ADMA) and efflux of cardioprotective L-homoarginine.PLoS One. 2019 Mar 13;14(3):e0213747. doi: 10.1371/journal.pone.0213747. eCollection 2019. PLoS One. 2019. PMID: 30865704 Free PMC article.
-
Roles of organic anion transporters (OATs) in renal proximal tubules and their localization.Anat Sci Int. 2017 Mar;92(2):200-206. doi: 10.1007/s12565-016-0369-3. Epub 2016 Sep 10. Anat Sci Int. 2017. PMID: 27614971 Review.
-
Renal Drug Transporters and Drug Interactions.Clin Pharmacokinet. 2017 Aug;56(8):825-892. doi: 10.1007/s40262-017-0506-8. Clin Pharmacokinet. 2017. PMID: 28210973 Review.
Cited by
-
Understanding specificity of the mycosin proteases in ESX/type VII secretion by structural and functional analysis.J Struct Biol. 2013 Nov;184(2):115-28. doi: 10.1016/j.jsb.2013.09.022. Epub 2013 Oct 7. J Struct Biol. 2013. PMID: 24113528 Free PMC article.
-
Potential and Limits of Kidney Cells for Evaluation of Renal Excretion.Pharmaceuticals (Basel). 2021 Sep 7;14(9):908. doi: 10.3390/ph14090908. Pharmaceuticals (Basel). 2021. PMID: 34577608 Free PMC article.
-
Evaluation of a Potential Clinical Significant Drug-Drug Interaction between Digoxin and Bupropion in Cynomolgus Monkeys.Pharm Res. 2018 Nov 6;36(1):1. doi: 10.1007/s11095-018-2525-z. Pharm Res. 2018. PMID: 30402714
-
Total and Extracellular Vesicle cAMP Contents in Urine Are Associated with Autosomal Dominant Polycystic Kidney Disease (ADPKD) Progression.Life (Basel). 2023 Aug 28;13(9):1817. doi: 10.3390/life13091817. Life (Basel). 2023. PMID: 37763221 Free PMC article.
-
Use of In Vivo Imaging and Physiologically-Based Kinetic Modelling to Predict Hepatic Transporter Mediated Drug-Drug Interactions in Rats.Pharmaceutics. 2023 Mar 10;15(3):896. doi: 10.3390/pharmaceutics15030896. Pharmaceutics. 2023. PMID: 36986758 Free PMC article.
References
-
- Nies AT, Schwab M, Keppler D. Interplay of conjugating enzymes with OATP uptake transporters and ABCC/MRP efflux pumps in the elimination of drugs. Expert Opin Drug Metab Toxicol. 2008;4:545–568. - PubMed
-
- Ito K, Suzuki H, Horie T, Sugiyama Y. Apical/basolateral surface expression of drug transporters and its role in vectorial drug transport. Pharm Res. 2005;22:1559–1577. - PubMed
-
- Bergwerk AJ, Shi X, Ford AC, Kanai N, Jacquemin E, et al. Immunologic distribution of an organic anion transport protein in rat liver and kidney. American Journal of Physiology - Gastrointestinal and Liver Physiology. 1996;271:G231–G238. - PubMed
-
- Masuda S, Saito H, Nonoguchi H, Tomita K, Inui K-i. mRNA distribution and membrane localization of the OAT-K1 organic anion transporter in rat renal tubules. FEBS Letters. 1997;407:127–131. - PubMed
Publication types
MeSH terms
Substances
Grants and funding
LinkOut - more resources
Full Text Sources
Molecular Biology Databases
