. 2012;7(6):e39750.
doi: 10.1371/journal.pone.0039750. Epub 2012 Jun 29.

Marking and quantifying IL-17A-producing cells in vivo

Affiliations

Marking and quantifying IL-17A-producing cells in vivo

April E Price et al. PLoS One. 2012.

Abstract

Interleukin (IL)-17A plays an important role in host defense against a variety of pathogens and may also contribute to the pathogenesis of autoimmune diseases. However, precise identification and quantification of the cells that produce this cytokine in vivo have not been performed. We generated novel IL-17A reporter mice to investigate expression of IL-17A during Klebsiella pneumoniae infection and during experimental autoimmune encephalomyelitis, conditions previously demonstrated to potently induce IL-17A production. In both settings, the majority of IL-17A was produced by non-CD4(+) T cells, particularly γδ T cells, but also invariant NKT cells and other CD4(-)CD3ε(+) cells. As measured in dual-reporter mice, IFN-γ-producing Th1 cells greatly outnumbered IL-17A-producing Th17 cells throughout both challenges. Production of IL-17A by cells from unchallenged mice or by non-T cells under any condition was not evident. Administration of IL-1β and/or IL-23 elicited rapid production of IL-17A by γδ T cells, invariant NKT cells and other CD4(-)CD3ε(+) cells in vivo, demonstrating that these cells are poised for rapid cytokine production and likely comprise the major sources of this cytokine during acute immunologic challenges.


Conflict of interest statement

Competing Interests: RML serves on the Scientific Review Board for Genentech/Roche and for the American Asthma Foundation. This does not alter the author’s adherence to all the PLoS ONE policies on sharing data and materials.

Figures

Figure 1
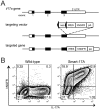
Figure 1. Generation of Smart-17A mice.
(A) Targeting strategy for the il17a locus. For detailed description, see Materials and Methods. (B) CD4+ T cells were isolated from wild-type or Smart-17A mice and polarized under Th17 conditions for 4 days. hNGFR was detected using a surface antibody and IL-17A was assayed using intracellular cytokine staining after restimulation. A representative flow cytometry plot is shown from >5 comparable experiments.
Figure 2
Figure 2. IL-17A expression in resting mice.
Cells were isolated from indicated organs of Smart-17A/RORγt reporter mice and levels of hNGFR were assayed. Populations were gated as described in Figure S2. All gates were set using a wild-type mouse as a negative control. * denotes cell populations that were too few in number to reliably assess marker expression. Representative flow cytometry plots are shown from 1 of 3 comparable experiments, each including 2–3 mice.
Figure 3
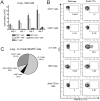
Figure 3. IL-17A expression during infection with Klebsiella pneumoniae.
Wild-type or Smart-17A mice were infected with 500–1000 K. pneumoniae. (A) At the indicated time points, cells were harvested from lungs and numbers of cells were enumerated. (B) Cells were isolated from the lungs of mice 2 days after infection and assayed for hNGFR expression. (C) The total number of hNGFR+ and YFP+ cells on day 2 post-infection were calculated and the percentage attributable to each cell population is shown in a pie graph. The percentage of background staining seen in a wild-type mouse under identical conditions was subtracted before performing all calculations to control for nonspecific staining. This experiment was repeated 3 times with n >3 mice at each time point. For bar and pie graphs, data from independent experiments were compiled. For flow cytometry, representative plots are shown.
Figure 4
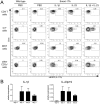
Figure 4. Expression of IL-17A from innate-like T lymphocytes cells can be induced by IL-1β and/or IL-23.
(A) Smart-17A mice were inoculated intranasally with PBS or with 500 ng IL-1β, IL-23 or both cytokines. Lungs were harvested 8 hr later and cells were analyzed for hNGFR expression. Gates were set using a wild-type control. The experiment was repeated 2 times and representative data are shown. (B) Wild-type mice were infected with K. pneumoniae and levels of IL-1β and the IL-23 subunit p19 mRNA in whole lung homogenate were measured using quantitative PCR. Expression of GAPDH was used as a reference to define relative expression. The experiment was done twice and a representative experiment is shown, n = 3 for all groups.
Figure 5
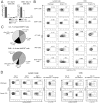
Figure 5. IL-17A expression during experimental autoimmune encephalomyelitis.
Wild-type or Smart-17A mice were immunized with MOG-CFA to induce EAE. (A) At the indicated time point, cells were harvested from the draining axial, brachial and inguinal lymph nodes (LN) at day 6 or spinal cords and cerebellums (CNS) at day 12 and numbers of cells were enumerated. (B) Cells were assayed for hNGFR expression. (C) The total numbers of hNGFR+ cells were calculated and the percentage attributable to each cell population is shown in a pie graph. The percentage of background staining seen in a wild-type mouse under identical conditions was subtracted before performing all calculations to control for nonspecific staining. (D) Cells were isolated from the LN or CNS and immediately stained for surface markers or restimulated for 5 hr with PMA/ionomycin and then stained for surface markers and/or intracellular expression of IL-17A. The experiments in A–C were repeated 3 times with n>2 mice at each time point. The experiment in D was repeated 2 times with n>5 mice at each time point. For bar and pie graphs, data from independent experiments were compiled. For flow cytometry, representative plots are shown. For the CNS data, mice were excluded that did not display symptoms of paralysis.
Figure 6
Figure 6. Differential production of IL-17A and IFN-γ in effector sites during inflammation.
(A) Expression of hNGFR and YFP was assessed in the lungs of mice at day 2 after infection with K. pneumoniae or in the spinal cord and cerebellum (CNS) of mice at day 12 after induction of EAE. (B) Numbers of hNGFR+ and YFP+ cells were enumerated during K. pneumoniae infection or EAE disease course. EAE disease scores were determined as described in Materials and Methods. ND  =  not detected. These experiment was repeated 3 times with n>2 mice at each time point or disease score. For flow cytometry, representative plots are shown. For bar graphs, data from individual experiments were compiled.

References

    1. Iwakura Y, Nakae S, Saijo S, Ishigame H. The roles of IL-17A in inflammatory immune responses and host defense against pathogens. Immunol Rev. 2008;226:57–79. - PubMed
    1. Puel A, Cypowyj S, Bustamante J, Wright JF, Liu L, et al. Chronic mucocutaneous candidiasis in humans with inborn errors of interleukin-17 immunity. Science. 2011;332:65–68. - PMC - PubMed
    1. Kisand K, Boe Wolff AS, Podkrajsek KT, Tserel L, Link M, et al. Chronic mucocutaneous candidiasis in APECED or thymoma patients correlates with autoimmunity to Th17-associated cytokines. J Exp Med. 2010;207:299–308. - PMC - PubMed
    1. Milner JD, Brenchley JM, Laurence A, Freeman AF, Hill BJ, et al. Impaired T(H)17 cell differentiation in subjects with autosomal dominant hyper-IgE syndrome. Nature. 2008;452:773–776. - PMC - PubMed
    1. Martin B, Hirota K, Cua DJ, Stockinger B, Veldhoen M. Interleukin-17-producing gammadelta T cells selectively expand in response to pathogen products and environmental signals. Immunity. 2009;31:321–330. - PubMed

Publication types

MeSH terms