

Design constraints on a synthetic metabolism
- PMID: 22768162
- PMCID: PMC3387219
- DOI: 10.1371/journal.pone.0039903
Design constraints on a synthetic metabolism
Abstract
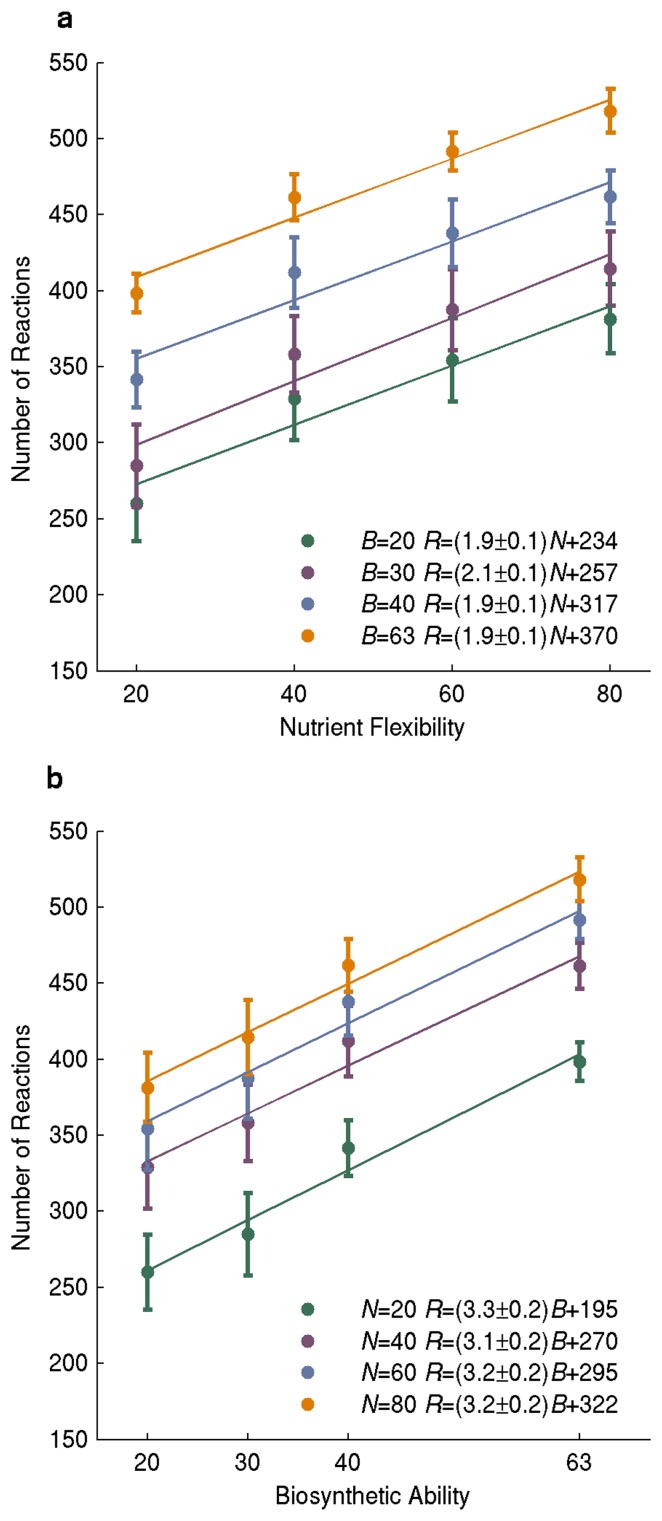
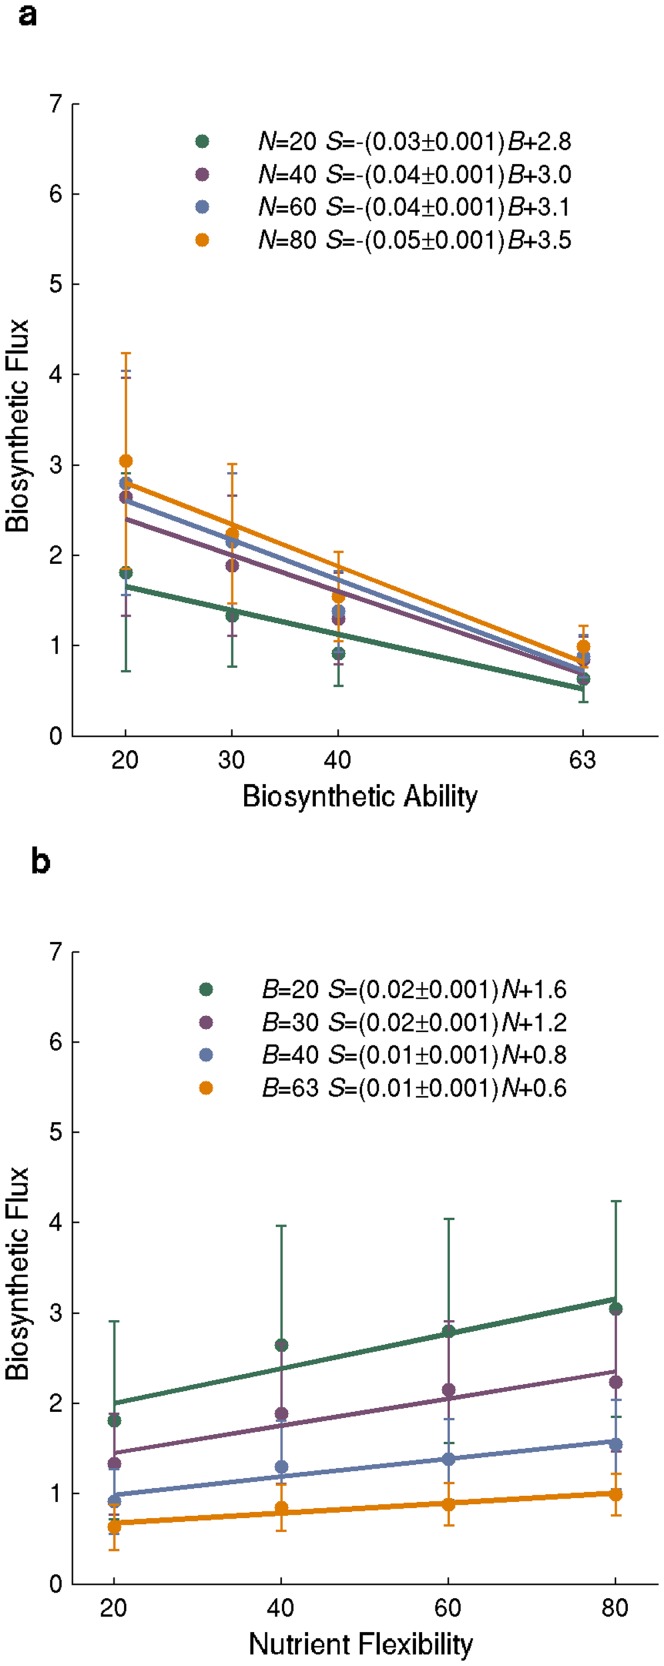
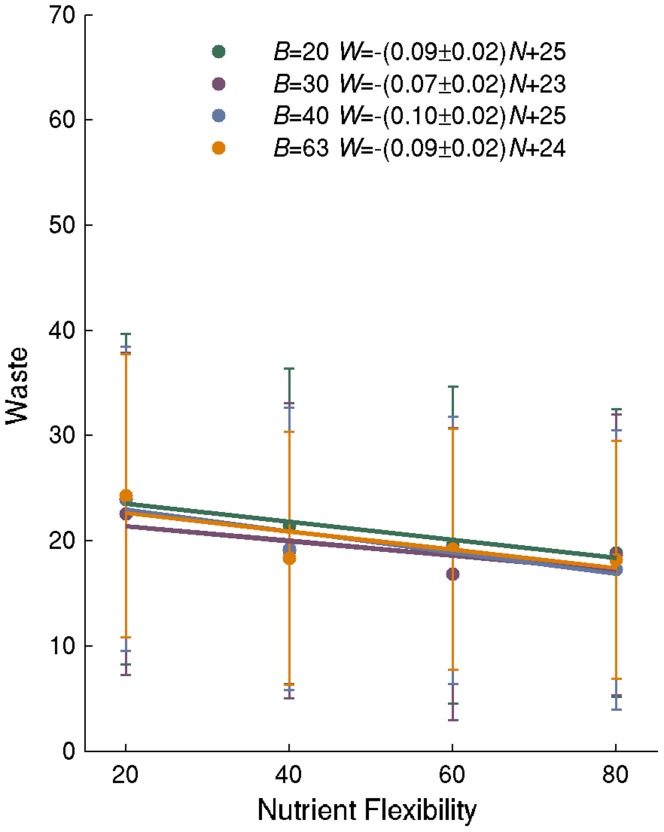
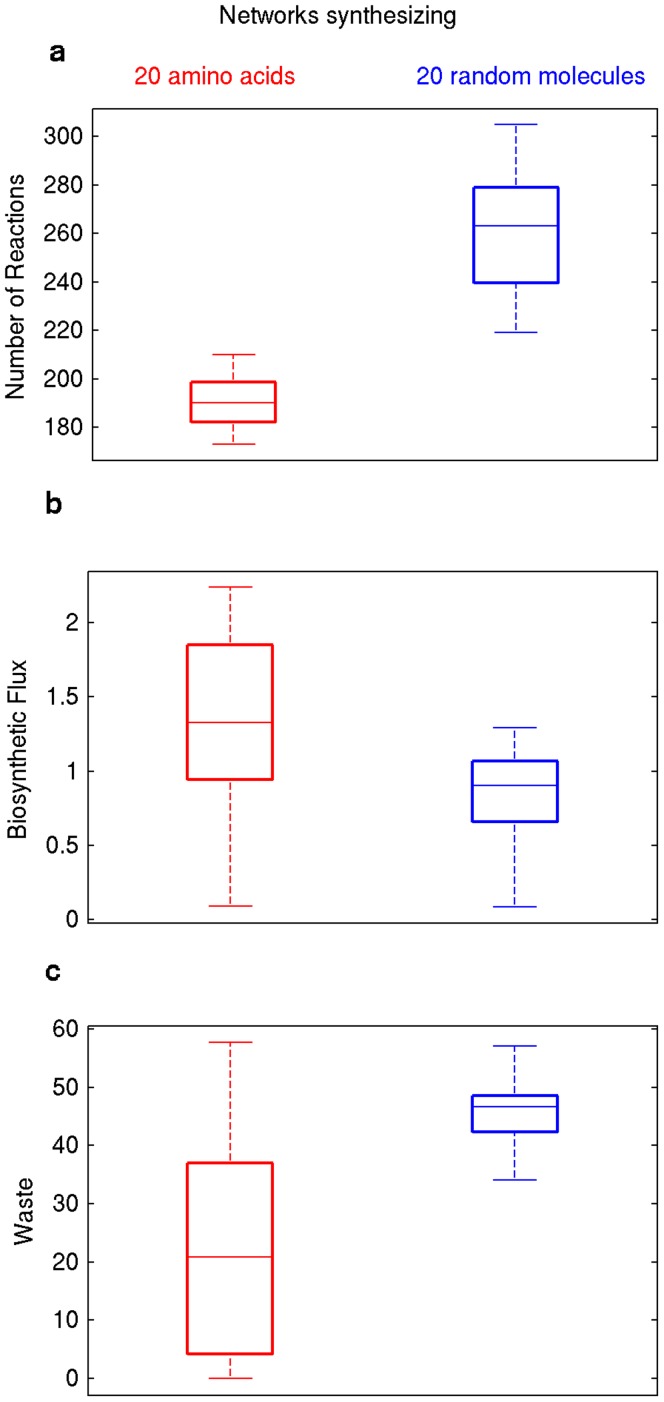
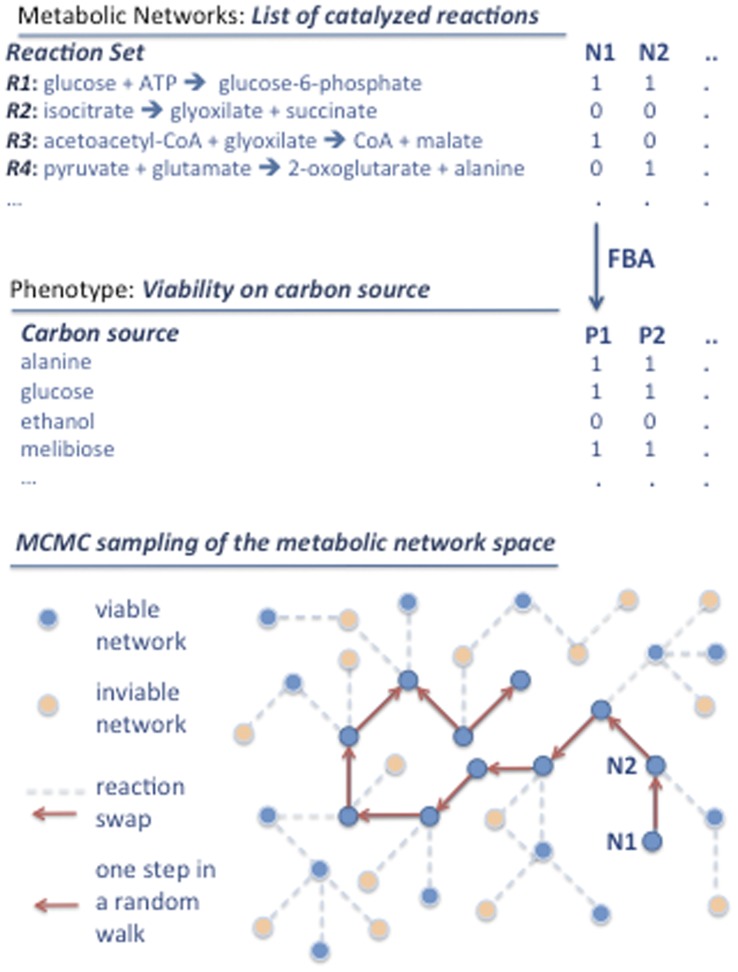
A metabolism is a complex network of chemical reactions that converts sources of energy and chemical elements into biomass and other molecules. To design a metabolism from scratch and to implement it in a synthetic genome is almost within technological reach. Ideally, a synthetic metabolism should be able to synthesize a desired spectrum of molecules at a high rate, from multiple different nutrients, while using few chemical reactions, and producing little or no waste. Not all of these properties are achievable simultaneously. We here use a recently developed technique to create random metabolic networks with pre-specified properties to quantify trade-offs between these and other properties. We find that for every additional molecule to be synthesized a network needs on average three additional reactions. For every additional carbon source to be utilized, it needs on average two additional reactions. Networks able to synthesize 20 biomass molecules from each of 20 alternative sole carbon sources need to have at least 260 reactions. This number increases to 518 reactions for networks that can synthesize more than 60 molecules from each of 80 carbon sources. The maximally achievable rate of biosynthesis decreases by approximately 5 percent for every additional molecule to be synthesized. Biochemically related molecules can be synthesized at higher rates, because their synthesis produces less waste. Overall, the variables we study can explain 87 percent of variation in network size and 84 percent of the variation in synthesis rate. The constraints we identify prescribe broad boundary conditions that can help to guide synthetic metabolism design.
Conflict of interest statement
Figures
Similar articles
-
Identification of flux trade-offs in metabolic networks.Sci Rep. 2021 Dec 10;11(1):23776. doi: 10.1038/s41598-021-03224-9. Sci Rep. 2021. PMID: 34893666 Free PMC article.
-
Genotype networks, innovation, and robustness in sulfur metabolism.BMC Syst Biol. 2011 Mar 7;5:39. doi: 10.1186/1752-0509-5-39. BMC Syst Biol. 2011. PMID: 21385333 Free PMC article.
-
MEMO: A Method for Computing Metabolic Modules for Cell-Free Production Systems.ACS Synth Biol. 2020 Mar 20;9(3):556-566. doi: 10.1021/acssynbio.9b00434. Epub 2020 Mar 2. ACS Synth Biol. 2020. PMID: 32069395 Free PMC article.
-
Metabolic Burden: Cornerstones in Synthetic Biology and Metabolic Engineering Applications.Trends Biotechnol. 2016 Aug;34(8):652-664. doi: 10.1016/j.tibtech.2016.02.010. Epub 2016 Mar 18. Trends Biotechnol. 2016. PMID: 26996613 Review.
-
Synthetic biology for microbial production of lipid-based biofuels.Curr Opin Chem Biol. 2015 Dec;29:58-65. doi: 10.1016/j.cbpa.2015.09.009. Epub 2015 Oct 23. Curr Opin Chem Biol. 2015. PMID: 26479184 Review.
Cited by
-
Exhaustive Analysis of a Genotype Space Comprising 10(15 )Central Carbon Metabolisms Reveals an Organization Conducive to Metabolic Innovation.PLoS Comput Biol. 2015 Aug 7;11(8):e1004329. doi: 10.1371/journal.pcbi.1004329. eCollection 2015 Aug. PLoS Comput Biol. 2015. PMID: 26252881 Free PMC article.
-
Synthetic biology and regulatory networks: where metabolic systems biology meets control engineering.J R Soc Interface. 2016 Apr;13(117):20151046. doi: 10.1098/rsif.2015.1046. Epub 2016 Apr 13. J R Soc Interface. 2016. PMID: 27075000 Free PMC article. Review.
-
A New Synthetic Pathway for the Bioproduction of Glycolic Acid From Lignocellulosic Sugars Aimed at Maximal Carbon Conservation.Front Bioeng Biotechnol. 2019 Nov 27;7:359. doi: 10.3389/fbioe.2019.00359. eCollection 2019. Front Bioeng Biotechnol. 2019. PMID: 31850327 Free PMC article.
-
Historical contingency and the gradual evolution of metabolic properties in central carbon and genome-scale metabolisms.BMC Syst Biol. 2014 Apr 23;8:48. doi: 10.1186/1752-0509-8-48. BMC Syst Biol. 2014. PMID: 24758311 Free PMC article.
-
Environmental flexibility does not explain metabolic robustness.NPJ Syst Biol Appl. 2020 Nov 27;6(1):39. doi: 10.1038/s41540-020-00155-5. NPJ Syst Biol Appl. 2020. PMID: 33247119 Free PMC article.
References
-
- Purnick PEM, Weiss R. The second wave of synthetic biology: from modules to systems. Nature reviews Molecular cell biology 10: 410–422. 2009. Available: http://www.ncbi.nlm.nih.gov/pubmed/19461664. Accessed 2011 Jun 10. - PubMed
-
- Smolke CD, Silver PA. Informing biological design by integration of systems and synthetic biology. Cell 144: 855–859. 2011. Available: http://www.ncbi.nlm.nih.gov/pubmed/21414477. Accessed 2011 Jun 10. - PMC - PubMed
-
- Sprinzak D, Elowitz MB. Reconstruction of genetic circuits. Nature 438: 443–448. 2005. Available: http://www.ncbi.nlm.nih.gov/pubmed/16306982. Accessed 2011 Jul 5. - PubMed
-
- Benner SA, Sismour AM. Synthetic biology. Nature Reviews Genetics 6: 533–543. 2005. Available: http://www.ncbi.nlm.nih.gov/pubmed/15995697. Accessed 2012 Jun 11. - PMC - PubMed
-
- Yarmush ML, Banta S. Metabolic engineering: advances in modeling and intervention in health and disease. Annual review of biomedical engineering 5: 349–381. 2003. Available: http://www.ncbi.nlm.nih.gov/pubmed/14527316. Accessed 2012 Jun 11. - PubMed
Publication types
MeSH terms
Substances
LinkOut - more resources
Full Text Sources
