. 2012;7(6):e40143.
doi: 10.1371/journal.pone.0040143. Epub 2012 Jun 29.

Osteocyte network; a negative regulatory system for bone mass augmented by the induction of Rankl in osteoblasts and Sost in osteocytes at unloading

Affiliations

Osteocyte network; a negative regulatory system for bone mass augmented by the induction of Rankl in osteoblasts and Sost in osteocytes at unloading

Takeshi Moriishi et al. PLoS One. 2012.

Abstract

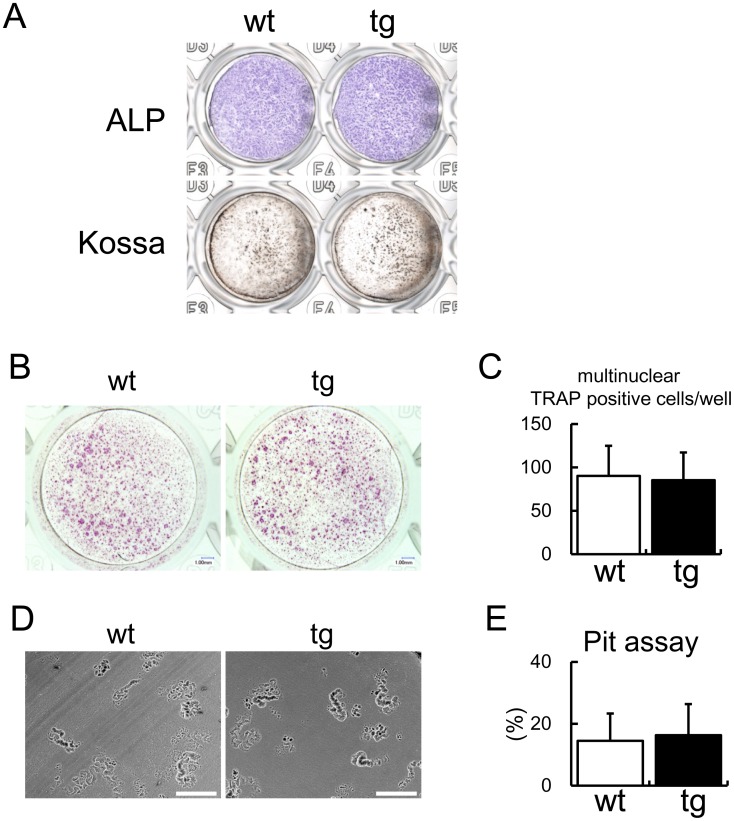
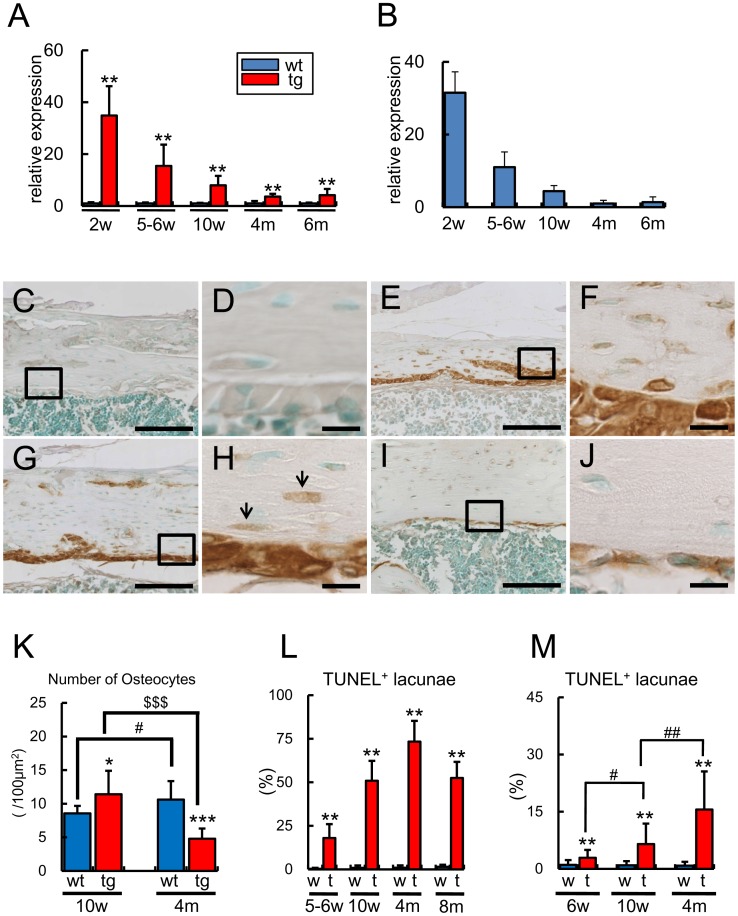
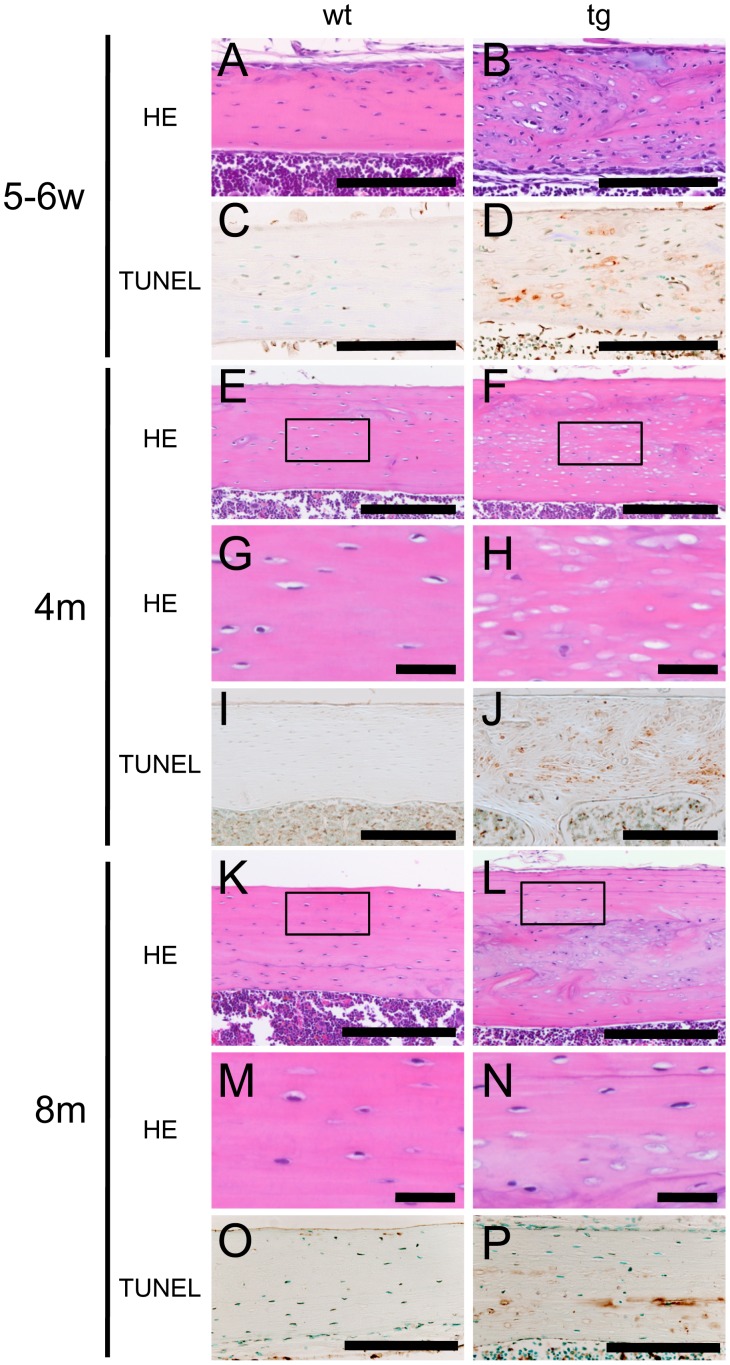
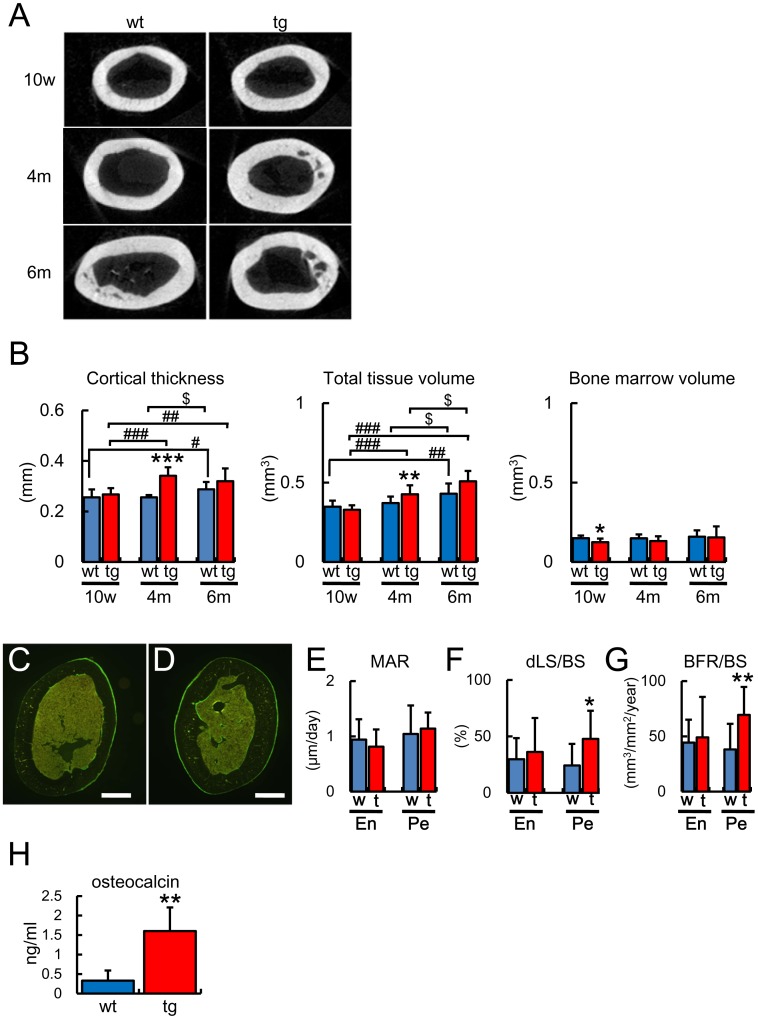
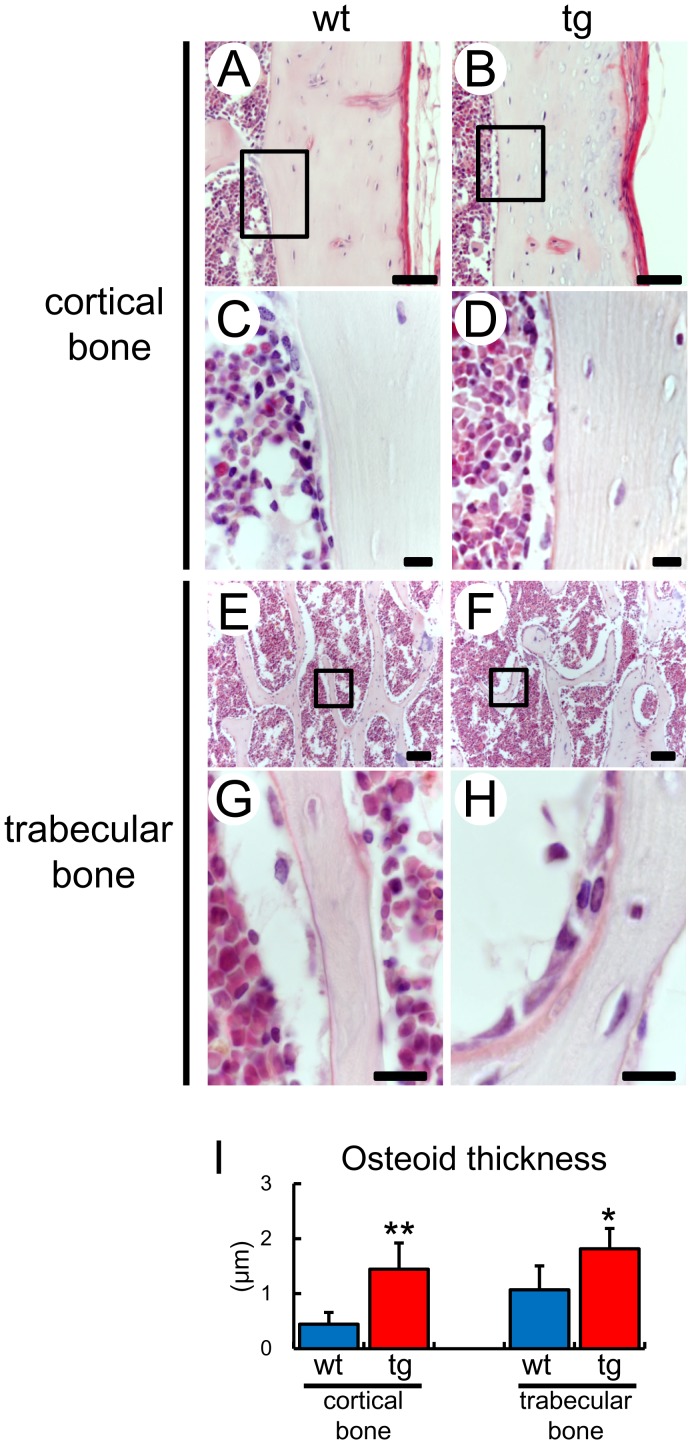
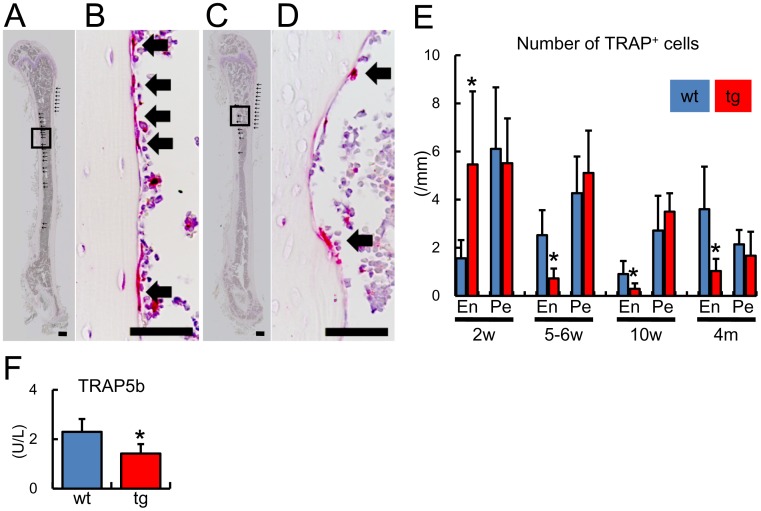
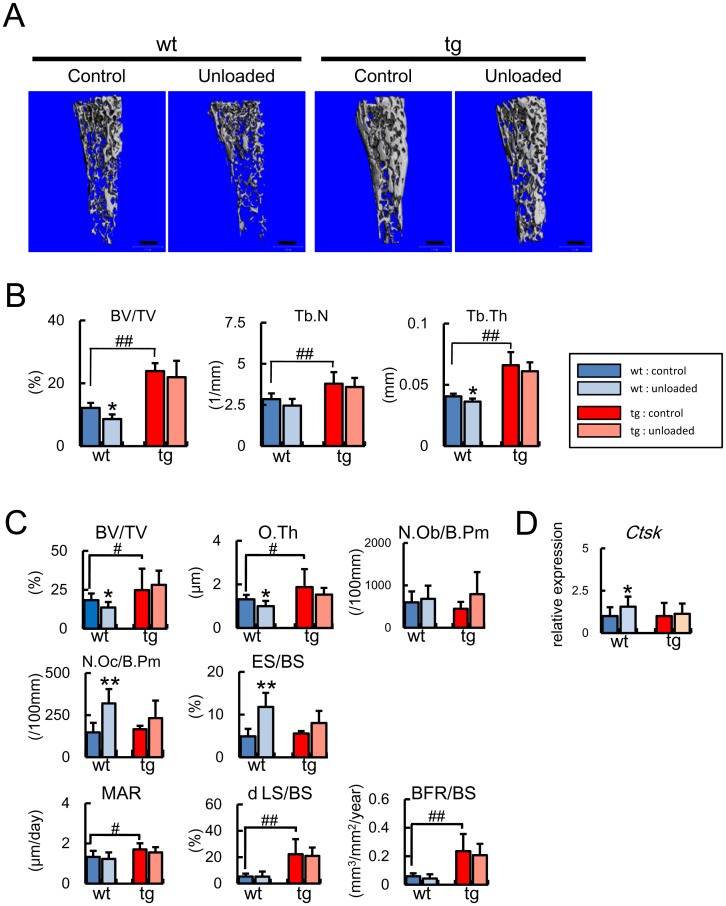
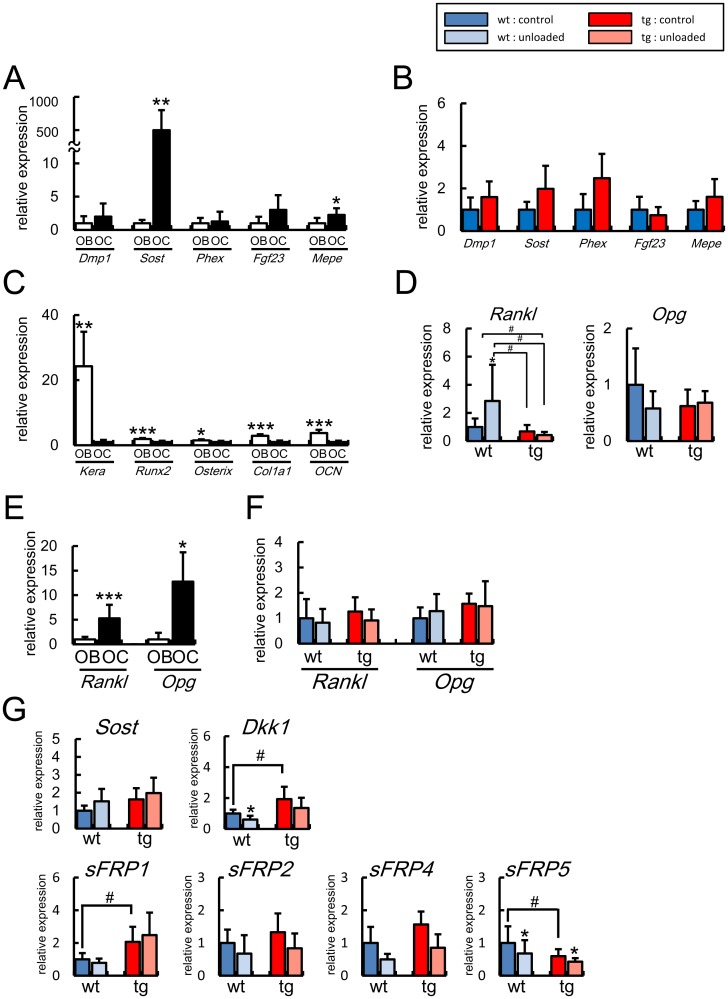
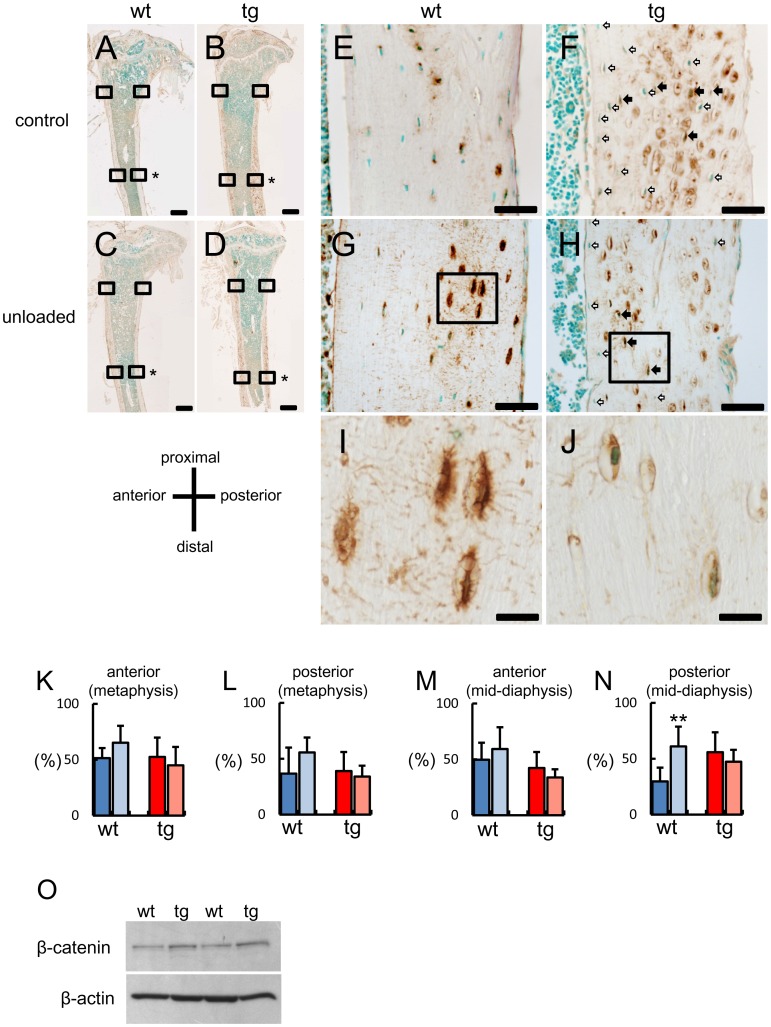
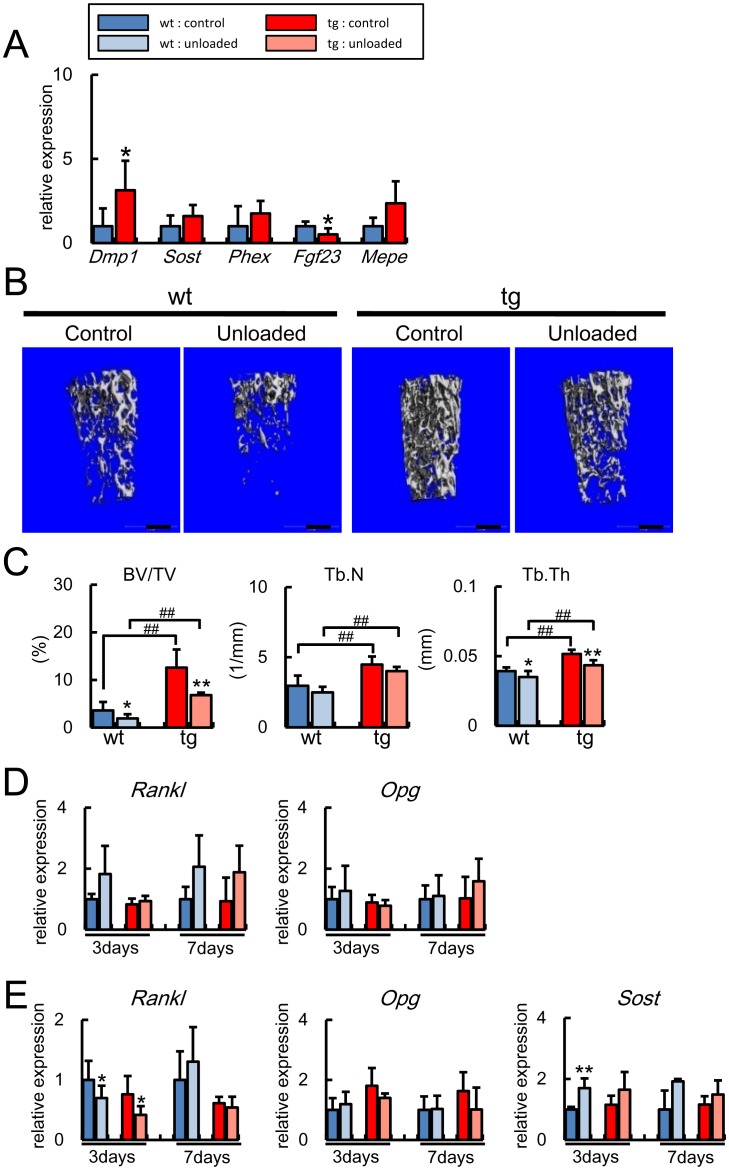
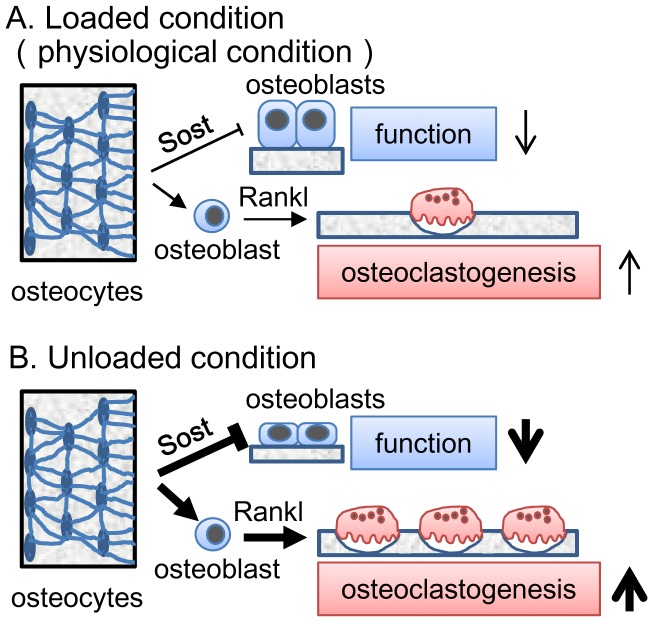
Reduced mechanical stress is a major cause of osteoporosis in the elderly, and the osteocyte network, which comprises a communication system through processes and canaliculi throughout bone, is thought to be a mechanosensor and mechanotransduction system; however, the functions of osteocytes are still controversial and remain to be clarified. Unexpectedly, we found that overexpression of BCL2 in osteoblasts eventually caused osteocyte apoptosis. Osteoblast and osteoclast differentiation were unaffected by BCL2 transgene in vitro. However, the cortical bone mass increased due to enhanced osteoblast function and suppressed osteoclastogenesis at 4 months of age, when the frequency of TUNEL-positive lacunae reached 75%. In the unloaded condition, the trabecular bone mass decreased in both wild-type and BCL2 transgenic mice at 6 weeks of age, while it decreased due to impaired osteoblast function and enhanced osteoclastogenesis in wild-type mice but not in BCL2 transgenic mice at 4 months of age. Rankl and Opg were highly expressed in osteocytes, but Rankl expression in osteoblasts but not in osteocytes was increased at unloading in wild-type mice but not in BCL2 transgenic mice at 4 months of age. Sost was locally induced at unloading in wild-type mice but not in BCL2 transgenic mice, and the dissemination of Sost was severely interrupted in BCL2 transgenic mice, showing the severely impaired osteocyte network. These findings indicate that the osteocyte network is required for the upregulation of Rankl in osteoblasts and Sost in osteocytes in the unloaded condition. These findings suggest that the osteocyte network negatively regulate bone mass by inhibiting osteoblast function and activating osteoclastogenesis, and these functions are augmented in the unloaded condition at least partly through the upregulation of Rankl expression in osteoblasts and that of Sost in osteocytes, although it cannot be excluded that low BCL2 transgene expression in osteoblasts contributed to the enhanced osteoblast function.


Conflict of interest statement

Competing Interests: The authors have declared that no competing interests exist.

Figures

Figure 1
Figure 1. Osteoblast differentiation and osteoclastogenesis in vitro.
(A) ALP activity and mineralization. Primary osteoblasts from wild-type and BCL2 transgenic mice were seeded on 48-well plates at a density of 8×10⁴/well and ALP staining and von Kossa staining were performed after culture for 4 days and 8 days, respectively. Sixteen wild-type and 13 BCL2 transgenic newborn mice were used in two independent experiments, and representative data are shown. (B–D) Co-culture of BMMs and primary osteoblasts. BMMs from wild-type mice were co-cultured with primary osteoblasts from wild-type or BCL2 transgenic mice. TRAP staining was performed after 6 days (B), and the number of multinucleated TRAP-positive cells was counted (C). The resorption activity of the osteoclasts was examined by Pit assay (D), and the resorption pits were measured after 6 days (E). Scale bars = 200 µm. Data are the mean ± S.D. of 5–8 mice. Similar results were obtained in two independent experiments and representative data are shown.
Figure 2
Figure 2. Transgene expression, osteocyte number, and the frequencies of TUNEL-positive lacunae.
(A, B) Real-time RT-PCR analyses of the expression of transgene (A) and Col1a1 (B). The expression levels of the transgene and Col1a1 were examined using RNA that had been extracted from the whole femurs at 2 weeks of age [wt, 8 mice; tg, 7 mice] and osteoblast-enriched samples at 5–6 weeks [wt, 13 mice; tg, 11 mice], 10 weeks [wt, 8 mice; tg, 5 mice], and 4 [wt, 3 mice; tg, 9 mice] and 6 [wt, 5 mice; tg, 8 mice] months of age. The values of wild-type mice were defined as 1, and relative levels are shown in A. The value at 4 months of age was defined as 1, and relative levels are shown in B. (C–J) Immunohistochemical analysis. Sections of wild-type mice at 2 weeks of age (C) and BCL2 transgenic mice at 2 weeks (E), 6 weeks (G), and 4 months (I) of age were reacted with anti-BCL2 antibody. Boxed regions in C, E, G, and I are magnified in D, F, H, and J, respectively. The arrows in H indicate immature osteocytes, which expressed the transgene. The lacunae, which were TUNEL-positive and contained cellular debris of dead osteocytes, were non-specifically reacted with anti-BCL2 antibody in BCL2 transgenic mice. Scale bars  = 100 µm (C, E, G, I); 10 µm (D, F, H, J). (K) The number of osteocytes in cortical bone. The number of osteocytes was counted in the cortical bone of femurs at 10 weeks [wt, 9 mice; tg, 12 mice] and 4 months [wt, 14 mice; tg, 13 mice] of age. (L and M) Frequencies of TUNEL-positive lacunae in cortical bone (L) and trabecular bone (M). TUNEL-positive lacunae were counted in femurs at 5–6 weeks [wt, 5 mice; tg, 6 mice], 10 weeks [wt, 7 mice; tg, 9 mice], and 4 [wt, 4 mice; tg, 4 mice] and 6 [wt, 4 mice; tg, 7 mice] months of age. The number of TUNEL-positive lacunae was presented as a percentage of the total number of lacunae. In A, B, and K–M, data are presented as the mean ± S.D. *vs. wild-type mice. *P<0.05, **P<0.01, ***P<0.001, #P<0.05, ##P<0.01, $$$P<0.001.
Figure 3
Figure 3. Osteocyte apoptosis in cortical bone.
H–E (A, B, E–H, K–N) and TUNEL (C, D, I, J, O, P) staining of cortical bone at the diaphyses of femurs of wild-type mice (A, C, E, G, I, K, M, O) and BCL2 transgenic mice (B, D, F, H, J, L, N, P) at 5–6 weeks (A–D), 4 months (E–J), and 8 months of age (K–P). Boxed regions in E, F, K, and L are magnified in G, H, M, and N, respectively. At 8 months of age, osteocytes with a normal appearance are located in the periphery of the cortical bone of BCL2 transgenic mice (L, N). Scale bars  = 0.1 mm (A–F, I–L, O, P); 20 µm (G, H, M, N).
Figure 4
Figure 4. Micro-CT and bone histomorphometric analyses of cortical bone (A, B) Micro-CT analysis.
Micro-CT images of mid-diaphyses of femurs (A) and cortical thickness, total tissue volume, and bone marrow volume (B) in male wild-type mice (wt) and BCL2 transgenic mice (tg) at 10 weeks [wt, 17 mice; tg, 7 mice], 4 months [wt, 14 mice; tg, 10 mice], and 6 months [wt, 6 mice; tg, 6 mice] of age. Data are presented as the mean ± S.D. (C–G) Dynamic histomorphometric analysis of cortical bone at 4 months of age. C and D, Cross-sections from the mid-diaphyses of femurs of male wild-type mice (C) and BCL2 transgenic mice (D), in which calcein had been injected twice. Scale bars = 0.5 mm. E–G, Mineral apposition rate (MAR) (E), double-labeled surface (dLS/BS) (F), and bone formation rate (BFR/BS) (G) in the endosteum (En) and periosteum (Pe) at the mid-diaphyses of femurs of wild-type mice (w, blue) and BCL2 transgenic mice (t, red). Data are the mean ± S.D. of 10 mice. *vs. wild-type mice. *, ♯, $ P<0.05; **, ♯♯ P<0.01; ***, ♯♯♯ P<0.001. (H) Comparison of the serum osteocalcin level in male four wild-type mice and five BCL2 transgenic mice at 4 months of age. Data are presented as the mean ± S.D. *vs. wild-type mice. **P<0.01.
Figure 5
Figure 5. Increase of osteoid in BCL2 transgenic mice at 4 months of age.
Cortical bone (A–D) and trabecular bone (E–H) of femurs in wild-type (A, C, E, G) and BCL2 transgenic (B, D, F, H) mice at 4 months of age. The boxed regions in A, B, E, and F are magnified in C, D, G, and H, respectively. Osteoid was visualized by Goland-Yoshilki method. Scale bars = 50 µm (A, B, E, F); 10 µm (C, D, G, H). (I) Osteoid thickness. Data are presented as the mean ± S.D. *vs. wild-type mice. *P<0.05, **P<0.01. wt, 4 mice; tg, 5 mice.
Figure 6
Figure 6. Bone resorption in BCL2 transgenic mice.
(A–E) Number of osteoclasts in cortical bone. A–D, Sections of femurs stained with TRAP in male wild-type mice (A, B) and BCL2 transgenic mice (C, D) at 4 months of age. Boxed regions in A and C are magnified in B and D, respectively. Arrows show TRAP-positive cells. Sections were counterstained with hematoxylin. Scale bars = 0.5 mm (A, C); 50 µm (B, D). E, Number of TRAP-positive cells in the endosteum (En) and periosteum (Pe) of femurs of male wild-type mice (blue) and BCL2 transgenic mice (red) at 2 weeks [wt, 4 mice; tg, 5 mice], 5–6 weeks [wt, 3 mice; tg, 4 mice], 10 weeks [wt, 6 mice; tg, 5 mice], and 4 months [wt, 5 mice; tg, 5 mice] of age. Data are presented as the mean ± S.D. (F) Comparison of the serum TRAP5b level in male three wild-type mice and five BCL2 transgenic mice at 4 months of age. Data are presented as the mean ± S.D. *vs. wild-type mice. *P<0.05.
Figure 7
Figure 7. Micro-CT, bone histomorphometry, and real-time RT-PCR analyses after unloading at 4 months of age.
(A, B) Micro-CT analysis. Tail suspension was performed for 2 weeks using male wild-type mice [control group, 13 mice; unloaded group, 9 mice] and BCL2 transgenic mice [control group, 8 mice; unloaded group, 8 mice] at 4 months of age. A, Micro-CT images of femurs. Scale bars = 0.5 mm. B, Trabecular bone volume (BV/TV), trabecular number (Tb.N), and trabecular thickness (Tb.Th) were evaluated by micro-CT. (C) Bone histomorphometrical analysis of trabecular bone. The trabecular bone volume (BV/TV), osteoid thickness (O.Th), number of osteoblasts (N.Ob/B.Pm), number of osteoclasts (N.Oc/B.Pm), eroded surface (ES/BS), mineral apposition rate (MAR), double-labeled surface (dLS/BS), and bone formation rate (BFR/BS) were measured on distal femoral metaphysis in wild-type mice [control group, 8 mice; unloaded group, 11 mice] and BCL2 transgenic mice [control group, 8 mice; unloaded group, 6 mice] at 4 months of age. (D) Ctsk expression. Tail suspension was performed for 3 days and Ctsk expression was examined by real-time RT-PCR analysis using osteoblast-enriched samples from wild-type mice [control group, 9 mice; unloaded group, 11 mice] and BCL2 transgenic mice [control group, 6 mice; unloaded group, 5 mice] at 4 months of age. The values of the control groups were defined as 1, and relative levels are shown. In B–D, data are presented as the mean ± S.D. *vs. control. *, ♯ P<0.05; **, ♯♯ P<0.01.
Figure 8
Figure 8. Real-time RT-PCR analyses of the expression of osteocyte and osteoblast marker genes, Rankl, Opg, and Wnt antagonist genes at 4 months of age.
(A) Expression of Dmp1, Sost, Phex, Fgf23, and Mepe in the osteoblast fractions (OB, n = 6) and osteocyte fractions (OC, n = 9) of wild-type mice. The values of osteoblast fractions were defined as 1, and relative levels are shown. *vs. osteoblast fractions. (B) Expression of Dmp1, Sost, Phex, Fgf23, and Mepe in control groups of wild-type mice (n = 4) and BCL2 transgenic mice (n = 5). The values of wild-type mice were defined as 1, and relative levels are shown. (C) Expression of osteoblast marker genes. Expressions of keratocan (Kera), Runx2, Osterix, Col1a1, and osteocalcin (OCN) were examined by real-time RT-PCR using osteoblast-enriched samples and osteocyte-enriched samples from 7 wild-type mice at 6 weeks of age. The values of osteocyte fractions were defined as 1, and relative levels are shown. *vs. osteocyte fractions. (D) Rankl and Opg expression in osteoblast-enriched samples after unloading. Tail suspension was performed for 3 days using male wild-type mice [control group, 8 mice; unloaded group, 9 mice] and BCL2 transgenic mice [control group, 12 mice; unloaded group, 6 mice] at 4 months of age. (E) Expression of Rankl and Opg in the osteoblast fractions (OB) and osteocyte fractions (OC) from 6 and 11 wild-type mice at 4 months of age, respectively. The values of osteoblast fractions were defined as 1, and relative levels are shown. *vs. osteoblast fractions. (F) Expression of Rankl and Opg in osteocyte-enriched samples. Tail suspension was performed for 3 days using male wild-type mice [control group, 9 mice; unloaded group, 8 mice] and BCL2 transgenic mice [control group, 12 mice; unloaded group, 11 mice] at 4 months of age. (G) Expression of Wnt antagonist genes in osteocyte-enriched samples after unloading. Tail suspension was performed for 3 days using male wild-type mice and BCL2 transgenic mice at 4 months of age (8 mice in each group). The values of the control group of wild-type mice were defined as 1, and relative levels are shown in D, F, and G. In A–G, data are presented as the mean ± S.D. *vs. control in D, F, and G. *, ♯ P<0.05; **P<0.01; ***P<0.001.
Figure 9
Figure 9. Immunohistochemical analysis of Sost after unloading.
Immunohistochemistry using anti-Sost antibody in tibial sections of control (A, B, E, F) and unloaded (C, D, G–J) groups in wild-type (A, C, E, G, I) and BCL2 transgenic (B, D, F, H, J) mice at 4 months of age. The boxed regions with asterisks in A–D are magnified in E–G, respectively. The boxed regions in G and H are magnified in I and J, respectively. In F and H, closed arrows indicate Sost-positive osteocytes and open arrows indicate Sost-negative osteocytes. The lacunae with cellular debris in BCL2 transgenic mice were non-specifically stained with Sost antibody (F, H). The sections were counterstained with methylgreen. Note that Sost is distributed through canaliculi throughout bone in wild-type mice but not in BCL2 transgenic mice (I, J). Scale bars = 0.5 mm (A–D); 50 µm (E–H); 10 µm (I, J). (K–N) Frequency of Sost-positive cells in cortical bone. Sost-positive cells were counted in the anterior (K, M) and posterior (L, N) sides of cortical bone at the metaphysis (K, L) and mid-diaphysis (M, N) of tibiae. Tail suspension was performed for 14 days using male wild-type mice [control group, 7 mice; unloaded group, 9 mice] and BCL2 transgenic mice [control group, 9 mice; unloaded group, 8 mice] at 4 months of age. The number of Sost-positive osteocytes was presented as a percentage of the total number of osteocytes. Only the cells with a nucleus were counted. Data are presented as the mean ± S.D. *vs. control. **P<0.01. (O) Western blot analysis using anti-β-catenin antibody. Proteins were extracted from osteoblast fractions from wild-type and BCL2 transgenic mice at 4 months of age. β-actin was used as an internal control.
Figure 10
Figure 10. Real-time RT-PCR and micro-CT analyses at 6 weeks of age.
(A) Real-time RT-PCR analysis of osteocyte marker genes. RNA was extracted from osteocyte-enriched samples of control groups of wild-type mice and BCL2 transgenic mice at 6 weeks of age. The values of wild-type mice were defined as 1, and relative levels are shown. Data are presented as the mean ± S.D. of 3 mice. *vs. control. *P<0.05. (B, C) Micro-CT analysis of femurs. Tail suspension was performed for 1 week using male wild-type mice [control group, 10 mice; unloaded group, 8 mice] and BCL2 transgenic mice [control group, 9 mice; unloaded group, 6 mice] at 6 weeks of age. B, Micro-CT images. Scale bars  = 0.5 mm. C, Trabecular bone volume (BV/TV), trabecular number (Tb.N), and trabecular thickness (Tb.Th) were evaluated by micro-CT. Data are presented as the mean ± S.D. *vs. control. *,♯P<0.05, **,♯♯P<0.01. (D, E) Real-time RT-PCR analysis after unloading. Tail suspension was performed for 3 days or 7 days using male wild-type mice [control group, 4 mice; unloaded group, 5 mice] and BCL2 transgenic mice [control group, 4 mice; unloaded group, 4 mice] at 6 weeks of age, and RNA was extracted from osteoblast-enriched samples (D) and osteocyte-enriched samples (E) of the tibiae and femurs. The values of the control group of wild-type mice were defined as 1, and relative levels are shown. Data are presented as the mean ± S.D. *vs. control. *P<0.05, **P<0.01.
Figure 11
Figure 11. A model of osteocyte functions.
(A) In the loaded (physiological) condition, the osteocyte network inhibits osteoblast function, enhances osteoclastogenesis, and negatively regulates bone mass. (B) In the unloaded condition, the effect of osteocyte network on osteoblast function is augmented through the induction of Sost in osteocytes and that on osteoclastogenesis is augmented through the induction of Rankl in osteoblasts, resulting in reduced bone mass. The thickness of the lines and arrows in A and B reflects the strength of the effects.

References

    1. Wolff J. Das gesetz der transformation der knochen. Berlin: Springer-Verlag. - Reprint 300 Seiten - Mit vier Nachworten und historischen Dokumenten Auflage 2010. 1892.
    1. Martin RB. Does osteocyte formation cause the nonlinear refilling of osteons? Bone. 2000;26:71–78. - PubMed
    1. Ehrlich PJ, Lanyon LE. Mechanical strain and bone cell function: a review. Osteoporos Int. 2002;13:688–700. - PubMed
    1. Tate MLK. “Whither flows the fluid in bone?” An osteocyte’s perspective. J Biomech. 2003;36:1409–1424. - PubMed
    1. Burger EH, Klein-Nulend J. Mechanotransduction in bone–role of the lacuno-canalicular network. FASEB Journal. 1999;13 - PubMed

MeSH terms

Substances

LinkOut - more resources