. 2012;7(7):e39112.
doi: 10.1371/journal.pone.0039112. Epub 2012 Jul 2.

Pharmacokinetics of quinacrine efflux from mouse brain via the P-glycoprotein efflux transporter

Affiliations

Pharmacokinetics of quinacrine efflux from mouse brain via the P-glycoprotein efflux transporter

Misol Ahn et al. PLoS One. 2012.

Abstract

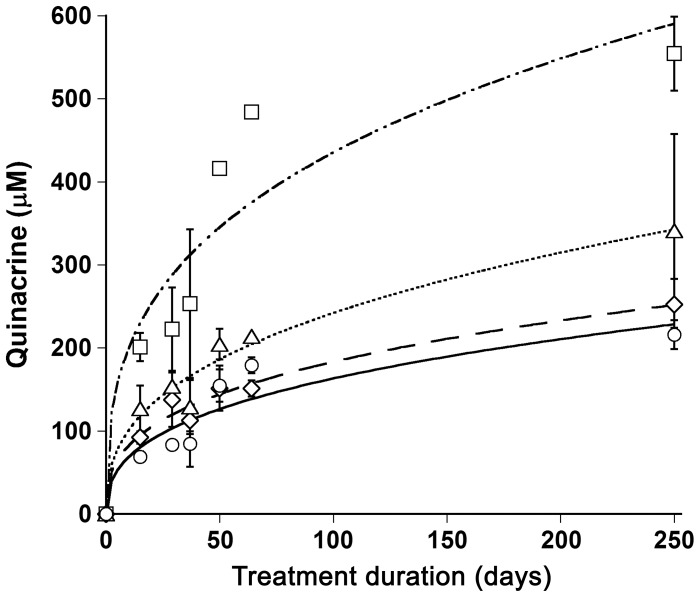
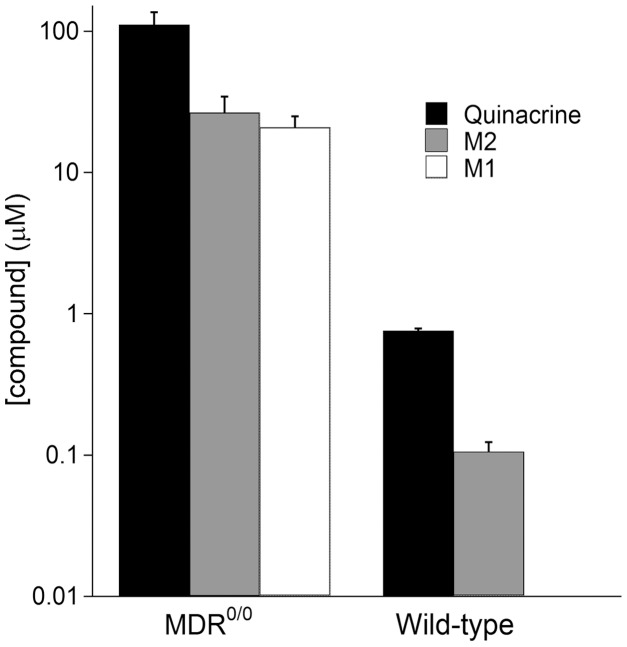
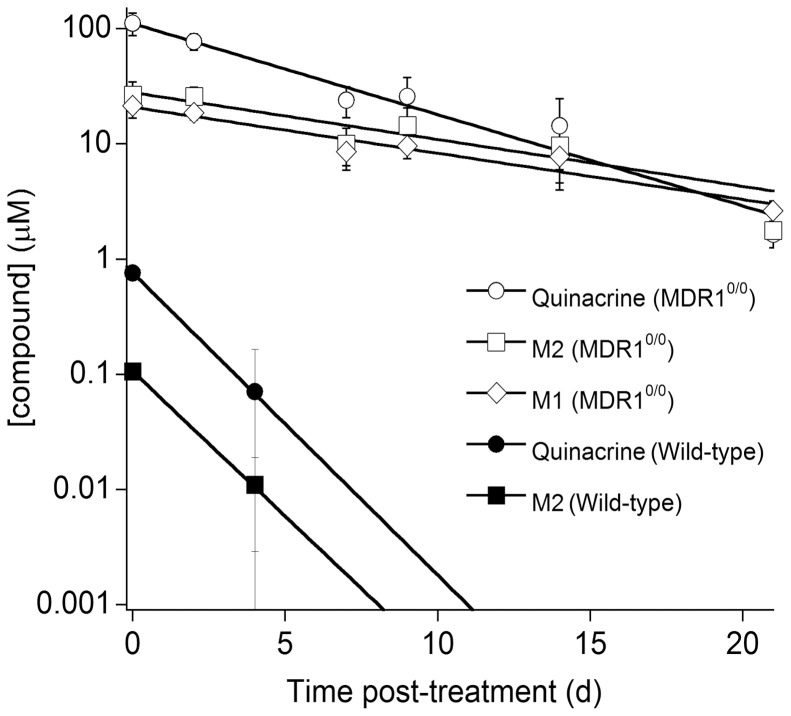
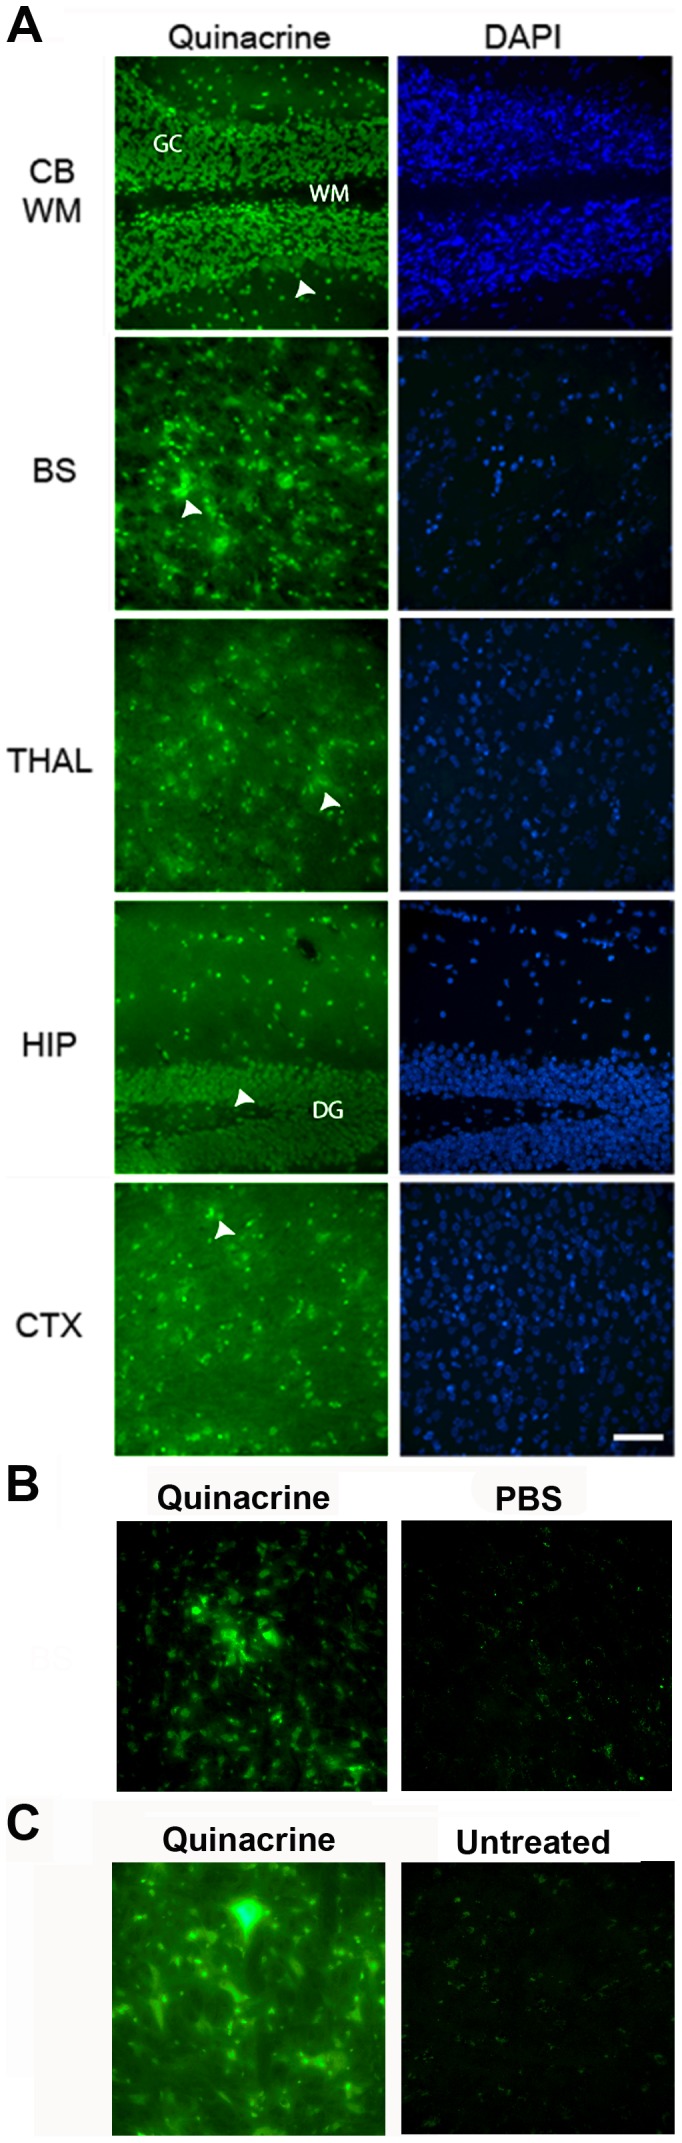
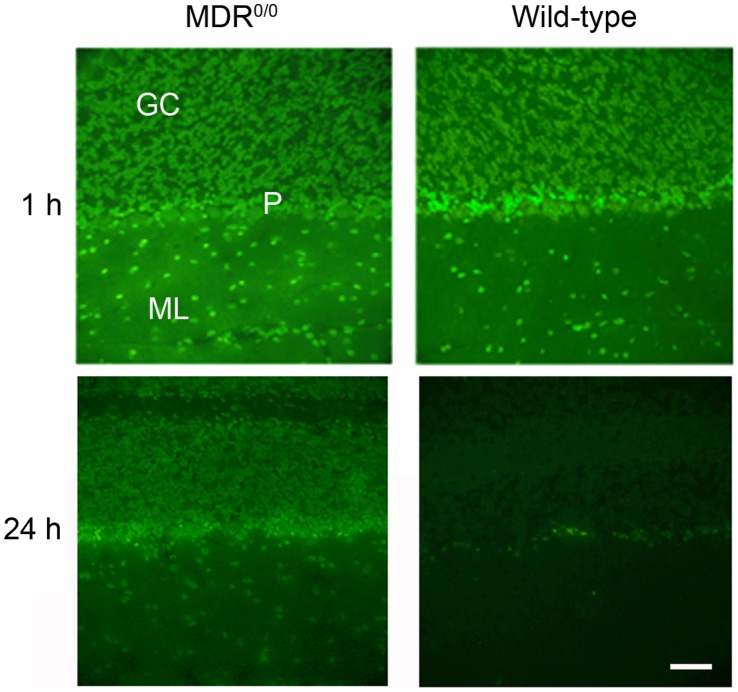
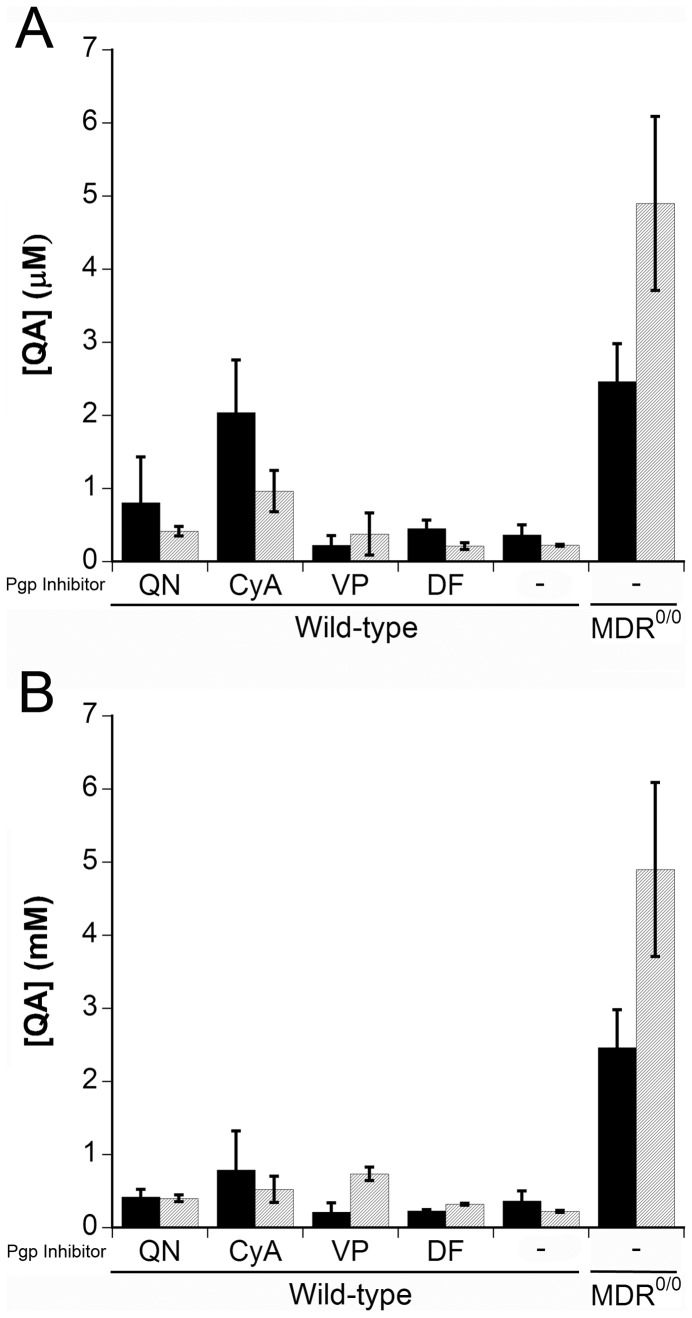
The lipophilic cationic compound quinacrine has been used as an antimalarial drug for over 75 years but its pharmacokinetic profile is limited. Here, we report on the pharmacokinetic properties of quinacrine in mice. Following an oral dose of 40 mg/kg/day for 30 days, quinacrine concentration in the brain of wild-type mice was maintained at a concentration of ∼1 µM. As a substrate of the P-glycoprotein (P-gp) efflux transporter, quinacrine is actively exported from the brain, preventing its accumulation to levels that may show efficacy in some disease models. In the brains of P-gp-deficient Mdr1(0/0) mice, we found quinacrine reached concentrations of ∼80 µM without any signs of acute toxicity. Additionally, we examined the distribution and metabolism of quinacrine in the wild-type and Mdr1(0/0) brains. In wild-type mice, the co-administration of cyclosporin A, a known P-gp inhibitor, resulted in a 6-fold increase in the accumulation of quinacrine in the brain. Our findings argue that the inhibition of the P-gp efflux transporter should improve the poor pharmacokinetic properties of quinacrine in the CNS.


Conflict of interest statement

Competing Interests: The authors have declared that no competing interests exist.

Figures

Figure 1
Figure 1. Quinacrine accumulation in brain (circles), spleen (triangles), liver (squares), and kidney (diamonds) tissues of Mdr1 0/0 mice.
Mdr1 0/0 mice were treated with 40 mg/kg/day of quinacrine in a chocolate-flavored liquid diet continuously for up to 250 d. Mice were euthanized at the time-points indicated and the quinacrine concentration in each tissue was measured by LC/MS/MS. Data points are the mean concentrations (n = 3) and the error bars represent SD.
Figure 2
Figure 2. Steady-state concentrations of quinacrine and its metabolites in wt and Mdr1 0/0 mouse brains.
Mice were treated with 40 mg/kg/day of quinacrine in a chocolate-flavored liquid diet for 31 d and then euthanized. The quinacrine concentration in the brain was measured by LC/MS/MS. Bars represent represent the mean concentration (n = 3); error bars represent SD. Y-axis shown in logarithmic scale. M1 metabolite levels for wild-type mice were under the detection limit.
Figure 3
Figure 3. Clearance of quinacrine and its metabolites in wt (filled symbols) and Mdr1 0/0 (open symbols) mouse brains.
Mice were treated with 40 mg/kg/day of quinacrine in a chocolate-flavored liquid diet for 31 d and then euthanized. The quinacrine concentration in the brain was measured by LC/MS/MS. Each data point represents the mean concentration (n = 3); error bars represent SD. Y-axis shown in logarithmic scale. Circles, quinacrine; diamonds, M1; squares, M2. Metabolite M1 levels for wt mice were under the detection limit.
Figure 4
Figure 4. Distribution of quinacrine in the brains of Mdr1 0/0 mice by fluorescence microscopy.
Mdr1 0/0 mice were treated with 20 mg/kg/day of quinacrine via IV tail-injection and euthanized after 1 h (A) and 3 h (B). In mice after 1 h, a high level of quinacrine fluorescence was seen in the nuclei of the cerebellum (CB) and hippocampus (HIP) as well as in the nerve cell bodies of the brainstem (BS), thalamus (THAL), and cortex (CTX). GC, granule cell layer; WM, white matter tract; DG, dentate gyrus; arrowheads, cell bodies of neurons or astrocytes. (B) In mice after 3 h, a high level of quinacrine fluorescence was observed only in the brainstem of quinacrine-treated mice (left) but not in the brainstem of PBS-treated mice (right). (C) Mice were treated with 40 mg/kg/day of quinacrine in a chocolate-flavored liquid diet for 25 days. A high level of quinacrine fluorescence was observed in the brainstem of quinacrine-treated mice (left), which was not observed in the brainstem of untreated mice (right). Scale bar in A represents 50 µm and applies to all images.
Figure 5
Figure 5. Distribution of quinacrine in the brains of Mdr1 0/0 and wt mice by fluorescence microscopy.
Mice were treated with 20 mg/kg of quinacrine via IV tail-injection and euthanized after 1 h or 24 h. Brains with the highest signals for both wt and Mdr1 0/0 mice were chosen to get the best quality images, taken at 40×. At 1 h, quinacrine fluorescence was strong in both Mdr1 0/0 and wt mice. At 24 h, quinacrine fluorescence was observed only in Mdr1 0/0 mice; only lipofuscin autofluorescence in Purkinje cells was observed in wt mice. Scale bar represents 50 µm and applies to all panels. GC, granule cell layer; P, Purkinje cell layer; ML, molecular cell layer.
Figure 6
Figure 6. Quinacrine accumulation in the brain of the wt mice cotreated with different P-gp inhibitors and quinacrine.
Wild-type mice (n = 4) were treated with 100 mg/kg of the indicated P-gp inhibitor by gavage; after 1 h (A) or 2 h (B), mice were treated with 10 mg/kg of quinacrine via gavage. Mice were then euthanized at 6 h (black bars) or 24 h (gray bars) after quinacrine treatment. As controls, wt and Mdr1 0/0 mice were treated only with quinacrine. The quinacrine concentrations were measured by LC/MS/MS. QA, quinacrine; QN, quinidine; CyA, cyclosporin A; VP, verapamil; DF, disulfiram; –, no P-gp inhibitor, QA only. Histograms are the mean concentrations (n = 4) and the error bars represent SD.

References

    1. Doh-ura K, Iwaki T, Caughey B. Lysosomotropic agents and cysteine protease inhibitors inhibit scrapie-associated prion protein accumulation. J Virol. 2000;74:4894–4897. - PMC - PubMed
    1. Korth C, May BCH, Cohen FE, Prusiner SB. Acridine and phenothiazine derivatives as pharmacotherapeutics for prion disease. Proc Natl Acad Sci USA. 2001;98:9836–9841. - PMC - PubMed
    1. Collins SJ, Lewis V, Brazier M, Hill AF, Fletcher A, et al. Quinacrine does not prolong survival in a murine Creutzfeldt-Jakob disease model. Ann Neurol. 2002;52:503–506. - PubMed
    1. Benito-Leon J. Combined quinacrine and chlorpromazine therapy in fatal familial insomnia. Clin Neuropharmacol. 2004;27:201–203. - PubMed
    1. Doh-ura K, Ishikawa K, Murakami-Kubo I, Sasaki K, Mohri S, et al. Treatment of transmissible spongiform encephalopathy by intraventricular drug infusion in animal models. J Virol. 2004;78:4999–5006. - PMC - PubMed

Publication types

MeSH terms