. 2012;7(7):e39448.
doi: 10.1371/journal.pone.0039448. Epub 2012 Jul 2.

The response of the prostate to circulating cholesterol: activating transcription factor 3 (ATF3) as a prominent node in a cholesterol-sensing network

Affiliations

The response of the prostate to circulating cholesterol: activating transcription factor 3 (ATF3) as a prominent node in a cholesterol-sensing network

Jayoung Kim et al. PLoS One. 2012.

Erratum in

  • PLoS One. 2012;7(8). doi:10.1371/annotation/b77e9022-f87c-4f77-9f82-9072351e3360

Abstract

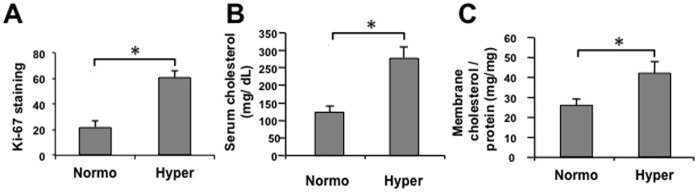
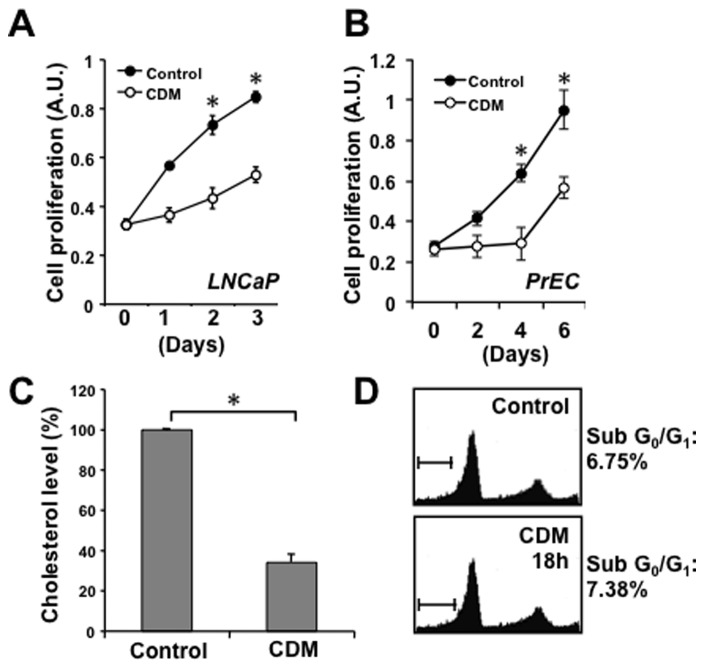
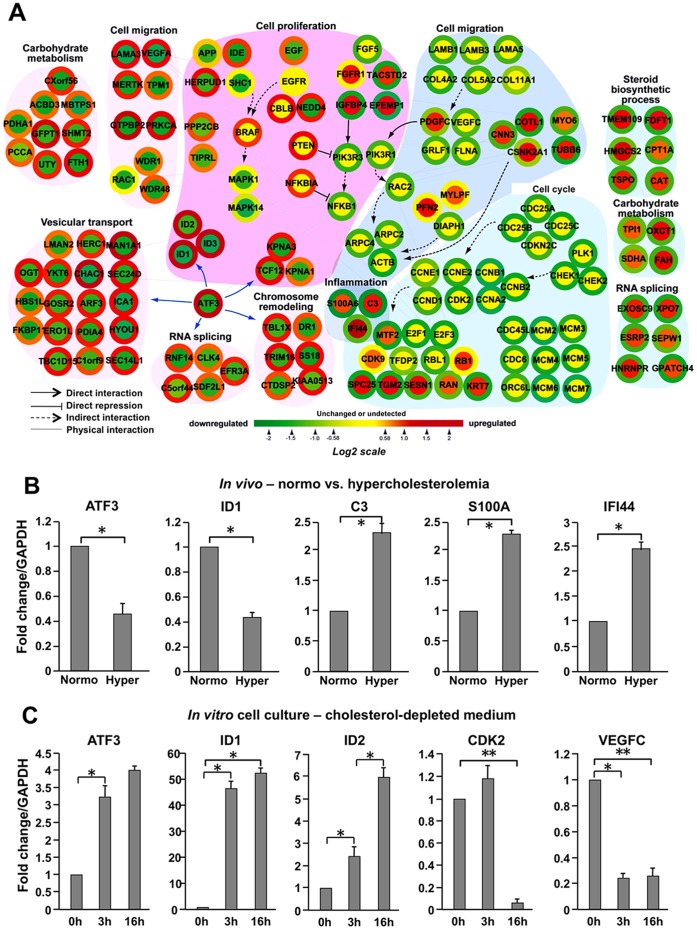
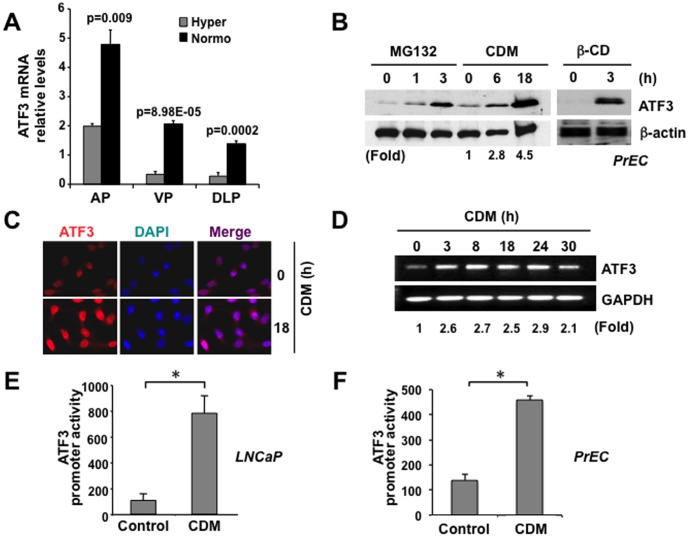
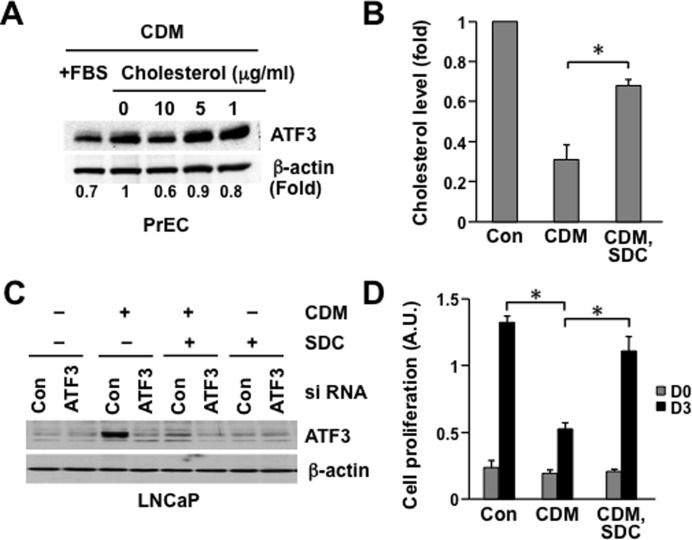
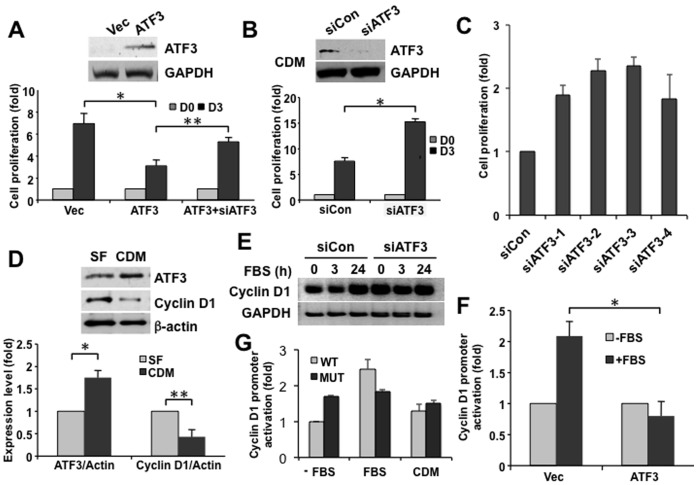
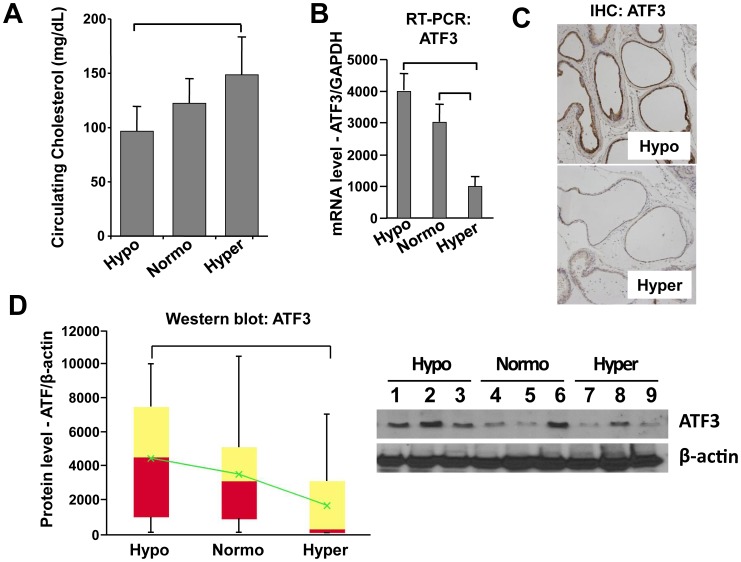
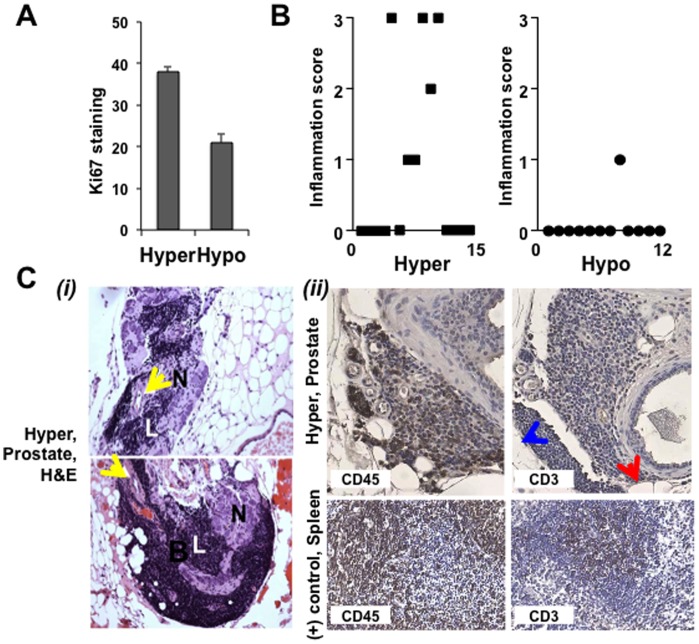
Elevated circulating cholesterol is a systemic risk factor for cardiovascular disease and metabolic syndrome, however the manner in which the normal prostate responds to variations in cholesterol levels is poorly understood. In this study we addressed the molecular and cellular effects of elevated and suppressed levels of circulating cholesterol on the normal prostate. Integrated bioinformatic analysis was performed using DNA microarray data from two experimental formats: (1) ventral prostate from male mice with chronically elevated circulating cholesterol and (2) human prostate cells exposed acutely to cholesterol depletion. A cholesterol-sensitive gene expression network was constructed from these data and the transcription factor ATF3 was identified as a prominent node in the network. Validation experiments confirmed that elevated cholesterol reduced ATF3 expression and enhanced proliferation of prostate cells, while cholesterol depletion increased ATF3 levels and inhibited proliferation. Cholesterol reduction in vivo alleviated dense lymphomononuclear infiltrates in the periprostatic adipose tissue, which were closely associated with nerve tracts and blood vessels. These findings open new perspectives on the role of cholesterol in prostate health, and provide a novel role for ATF3, and associated proteins within a large signaling network, as a cholesterol-sensing mechanism.


Conflict of interest statement

Competing Interests: The authors have declared that no competing interests exist.

Figures

Figure 1
Figure 1. Effect of dietary cholesterol on circulating and prostatic tissue cholesterol levels in vivo.
Male SCID mice were fed for 4 months (m) either a Hyper or a Normo diet, and circulating as well as prostatic tissue cholesterol levels determined. (A) Hyper diet enhances prostatic proliferation. 10 randomly selected sections per group were used for analysis with proliferating cells determined by Ki-67 staining. Ki-67 positivity is shown as average ± SD (n = 10/group) of positive cells in a total of 5000 prostate epithelial cells. (B) Circulating cholesterol levels. Serum cholesterol levels were determined and are plotted as cholesterol (mg/dL) vs. diet group ± SD (n = 15/group) (C) Cholesterol levels of prostate membrane. Cholesterol was extracted from membrane fractions prepared from prostate tissue and cholesterol levels determined by Infinity assay. Data are presented as cholesterol (mg/mg tissue) vs. group ± SD (n = 3/group). *p<0.05 (Student’s t-test).
Figure 2
Figure 2. Cholesterol depletion reduces cellular cholesterol levels and inhibits proliferation without inducing apoptosis.
(A–B) Cholesterol depletion reduces cellular proliferation of LNCaP (A) and PrEC cells (B). Cell proliferation was determined at the indicated times by crystal violet staining. Data are plotted as cell proliferation (A.U., absorption units) vs. time (days) ± SD (n = 5). (C) Incubation in cholesterol-depleted media (CDM) reduces cellular cholesterol levels. LNCaP cells were incubated in control media (RPMI 10% FBS) or CDM for 18 h. Cholesterol level data are presented as percent cholesterol vs. treatment ± SD (n = 3). (D) Cholesterol depletion does not induce apoptosis. LNCaP cells were treated in control media or CDM for 18 h and were analyzed for levels of apoptosis by flow cytometry. Cell populations at Sub-G0/G1 are apoptotic. *p<0.05 (Student’s t-test).
Figure 3
Figure 3. Network modeling of the cholesterol-responsive genes.
(A) A provisional network was generated from integration of two microarray data sets. Node color represents increases (red), no significant changes (yellow), and decreases (green) in gene expression in murine prostate tissue after cholesterol alteration as ascertained by cDNA microarray. Changes in RNA expression levels of the corresponding nodes in LNCaP cells are shown as colored node boundaries (donut shape) and the color represents increases (red), no significant change (yellow), and decreases (green) in gene expression under CDM conditions compared to control. Arrows indicate direct activation, T-shaped lines direct repression, dashed arrows indirect activation, and lines physical interaction. (B) Gene expression under Normo and Hyper conditions ( in vivo ). To verify in vivo microarray data obtained from SCID experiments, mRNA levels of the indicated genes were determined. GAPDH expression was used to normalize gene expression. Error bars represent SD (n = 3). (C) Gene expression under Control and Cholesterol-depleted conditions ( in vitro ). LNCaP cells were incubated in CDM for 0, 3 or 16 h, and mRNA levels of the indicated genes were measured by RT-PCR analysis to validate cDNA microarray data. Error bars represent SD (n = 3). *p<0.05 (Student’s t-test).
Figure 4
Figure 4. ATF3 expression coincides with reduced cholesterol.
(A) RT-PCR analysis in vivo . ATF3 levels are reduced in all prostatic lobes from Hyper mice, compared to those from the Normo group (AP = anterior prostate; VP = ventral prostate; DLP = dorsal prostate). (B) Immunoblot analysis. Immunoblot of PrEC lysates showed induction of ATF3 protein by CDM (left panel) and by β-cyclodextrin (right panel). MG132, a proteasome inhibitor, also increased ATF3 expression. (C) Immunofluorescence analysis. Induction of ATF3 protein by CDM in LNCaP cells as shown by IF. LNCaP cells were treated with CDM for 18 h, stained with anti-ATF3 antibody and nuclei were counterstained with DAPI (left panel: ATF3; middle panel: DAPI; right panel: overlay). (D) RT-PCR analysis. ATF3 mRNA levels in LNCaP cells treated with CDM were normalized to levels of GAPDH. RT-PCR analysis shows induction of ATF3 mRNA levels by CDM. (E–F) Promoter reporter analysis. A full-length ATF3 promoter was cloned into a luciferase reporter vector and transfected into LNCaP (D) or PrEC (E). Cells were then incubated in Control and CDM medium. ATF3 promoter activity was plotted as arbitrary units (± SD) after normalization with total protein concentration.
Figure 5
Figure 5. Cholesterol reduces ATF3 expression in prostate epithelial cells.
(A) PrEC were incubated in CDM for 18 h and then water-soluble cholesterol (cholesterol loaded cyclodextrin) was added to the medium in a dose dependent manner (0, 1, 5, and 10 µg/ml) for 3h. After immunoblot analysis, band intensities were normalized to β-actin and fold changes are shown. (B) Cholesterol-containing liposomes increase cholesterol level. LNCaP cells were incubated in CDM for 18 h in the absence or presence of cholesterol containing liposomes (SDC (33% (mol) sphingomyelin+DOPC+cholesterol) . Data are plotted as percent cholesterol level (± SD) (C) Cholesterol containing liposomes reverse ATF3 protein induction by CDM. LNCaP cells were transiently transfected with control siRNA (siCon) or siATF3. 48 h after transfection, cells were incubated in CDM for 18 h in the absence or presence of SDC. ATF3 protein levels were measured by immunoblot analysis. (D) Enhanced proliferation by cholesterol containing liposomes. LNCaP cells were incubated in CDM in the absence or presence of SDC . After 3 d, cell proliferation was measured. Data are plotted as cell proliferation (A.U., absorption units) vs. time (days) ± SD (n = 3). Con, serum containing growth medium; CDM, cholesterol depletion medium; SDC, cholesterol containing liposome preparation. *p<0.05 (Student’s t-test).
Figure 6
Figure 6. ATF3 is a negative regulator of cyclin D1 and cell proliferation.
(A) Enforced AFT3 expression reduces cell proliferation. LNCaP cells were transiently transfected with an ATF3 expression construct, a vector alone control, or with the AFT3 expression construct + ATF3 siRNAs. Proliferation rate was measured at the indicated times. ATF3 expression levels were verified by immunoblot (upper panels). Data are plotted as cell proliferation (fold) vs. condition (Vec, ATF3, ATF3+siATF3) ± SD (n = 3). (B–C) Knockdown of ATF3 increases cell proliferation. LNCaP cells were transiently transfected with siATF3 (or siCon) and the number of cells at day 0 (grey bars) & day 3 (black bars) were measured. Four independent ATF3 siRNAs (siATF3-1, -2, -3, and -4) were transiently transfected, and cell numbers were determined at day 3. Data are plotted as cell proliferation (fold) vs. condition ± SD (n = 3). (D) Effect of cholesterol depletion on ATF3 and cyclin D1 expression. LNCaP cell were treated in serum free media (SF; grey bars) or with CDM (black bars) for 16 h and the level of ATF3 and cyclin D1 were determined. Data were normalized to β-actin from the same blots. Immunoblot data are representative of the immunoblot result used in densitometry. Data are plotted as expression level (fold) vs. condition ± SD (n = 3). (E) ATF3 regulates cholesterol depletion-induced cyclin D1 expression (immunoblot analysis). LNCaP cells were transiently transfected with siATF3 (or siCon). After serum starvation for 16 h, cells were stimulated with 10% serum for the indicated times. Immunoblot analysis was performed to determine cyclin D1 expression in ATF3 deficient cells. (F) ATF3 regulates cyclin D1 expression (promoter reporter analysis). LNCaP cells were transfected with promoter construct of cyclin D1 containing a luciferase reporter and followed by additional incubation with ± serum for 6 h. Data are plotted as promoter activation (fold) vs. condition ± SD (n = 3). (G) Promoter activation of cyclin D1 upon cholesterol alteration requires ATF3 binding on promoter region (promoter reporter analysis). LNCaP cells were transfected with a luciferase construct of a wild type (WT) or an ATF3 binding site mutated cyclin D1 (MUT) promoter. Promoter activity was measured 6 h after treatment with various conditions (±FBS or CDM). Data are plotted as promoter activation (fold) vs. condition ± SD (n = 4). All experiments were performed a minimum of 3 times. *p<0.05, **p<0.01 (Student’s t-test).
Figure 7
Figure 7. ATF3 expression level is associated with cholesterol level in vivo.
Male C57BL/6 mice were fed Hypo, Normo, or Hyper diets for 4 months. (A) Circulating cholesterol levels. Serum cholesterol levels are plotted as cholesterol (mg/dL) vs. diet group ± SD (n = 18/group). (B) RT-PCR analyses of ATF3 expression. The expression levels of ATF3 mRNA and protein were compared in ventral prostate (VP) from male C57BL/6 mice in Hypo, Normo or Hyper conditions by quantitative densitometry. Data are plotted as mRNA level (arbitrary unit) vs. condition ± SD (n = 3). GAPDH expression was used to normalize gene expression. (C) Immunohistochemical analysis of ATF3 expression. Sections of VP tissues from mice in Hypo, Normo or Hyper groups, stained with anti-ATF3 antibody. Representative images of Hypo and Hyper are shown. (D) Immunoblot analyses of ATF3. Immunoblot data are presented as box and whisker plots of ATF3 expression levels (arbitrary units) vs. group. Bottom of red = median of lower half of the data. Top of yellow = median of upper half of the data. Intersection of red and yellow = median. Green = average. Vertical bars extend to maxima and minima (n =  18/group). *p<0.05 (two way ANOVA and Student’s t-test). Representative western blot data are shown (right).
Figure 8
Figure 8. Hypocholesterolemia suppresses prostatic inflammation.
(A) Proliferative index. Proliferating cells were counted by Ki-67 staining as described in Materials and Methods. Data are plotted as Ki-67 positive cells vs. condition. (B) Inflammation score. Infiltrating cells were scored as described in Materials and Methods. Data are plotted as inflammation score vs. condition. (C- i) VP lobes from male C57BL/6 mice in the Hyper condition. Lymphoid cell populations (L) infiltrating periprostatic adipose tissue adjacent to nerves (N) and blood vessels were observed in the Hyper condition (yellow arrows). Two representative fields are shown. (C- ii) IHC staining with anti-CD45 (1∶150) and anti-CD3 (1∶200) show inflammatory infiltrates observed in the Hyper condition are a mixture of B and T cells. Spleen tissue from male C57BL/6 mice was used as a positive control for IHC and protocol optimization. Blue arrowhead, adipose tissue; Red arrowhead, a prostatic acinus.

References

    1. Moyad MA, Lowe FC. Educating patients about lifestyle modifications for prostate health. Am J Med. 2008;121:S34–42. - PubMed
    1. de Ferranti S, Mozaffarian D. The perfect storm: obesity, adipocyte dysfunction, and metabolic consequences. Clin Chem. 2008;54:945–955. - PubMed
    1. Marcovecchio M, Mohn A, Chiarelli F. Type 2 diabetes mellitus in children and adolescents. J Endocrinol Invest. 2005;28:853–863. - PubMed
    1. Qi L, Saberi M, Zmuda E, Wang Y, Altarejos J, et al. Adipocyte CREB promotes insulin resistance in obesity. Cell Metab. 2009;9:277–286. - PMC - PubMed
    1. Freeman MR, Solomon KR. Cholesterol and prostate cancer. J Cell Biochem. 2004;91:54–69. - PubMed

Publication types