

NFAT5 is activated by hypoxia: role in ischemia and reperfusion in the rat kidney
- PMID: 22768306
- PMCID: PMC3388090
- DOI: 10.1371/journal.pone.0039665
NFAT5 is activated by hypoxia: role in ischemia and reperfusion in the rat kidney
Abstract
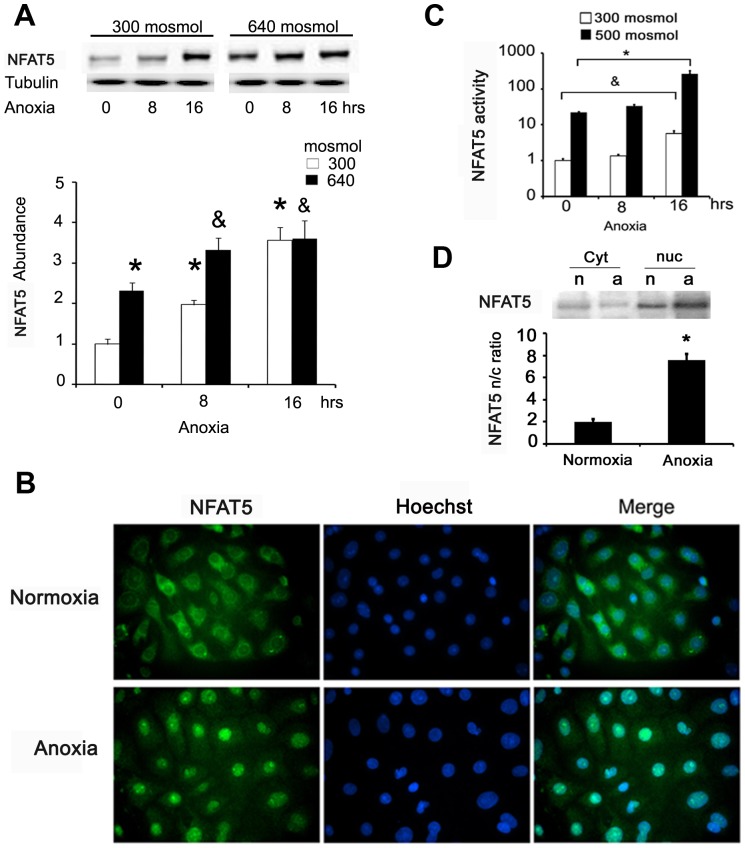
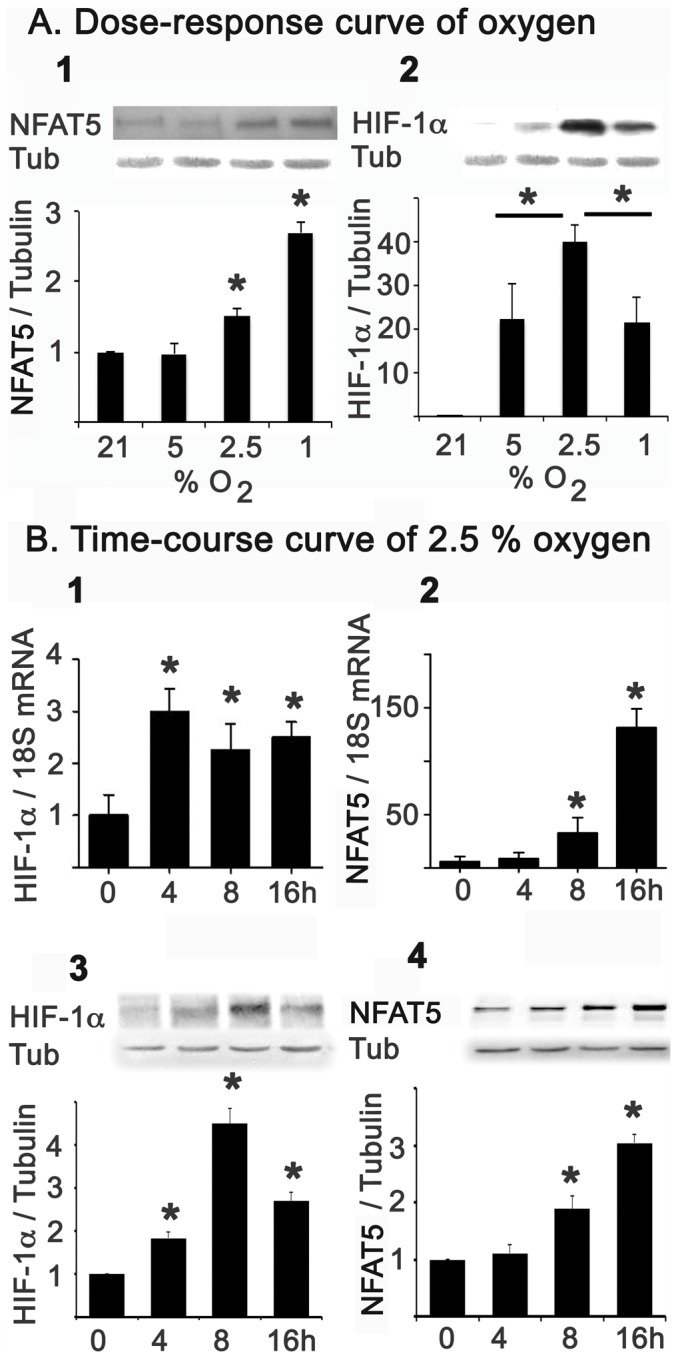
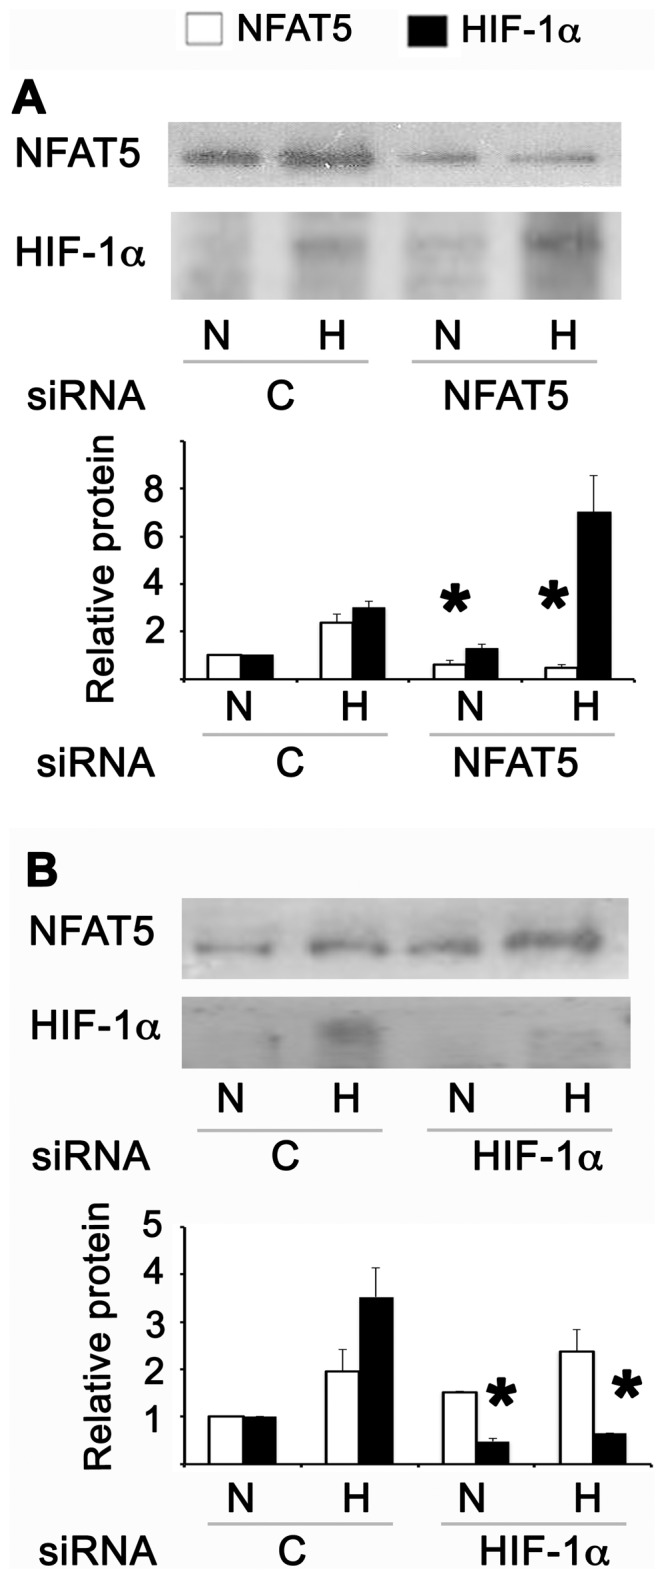
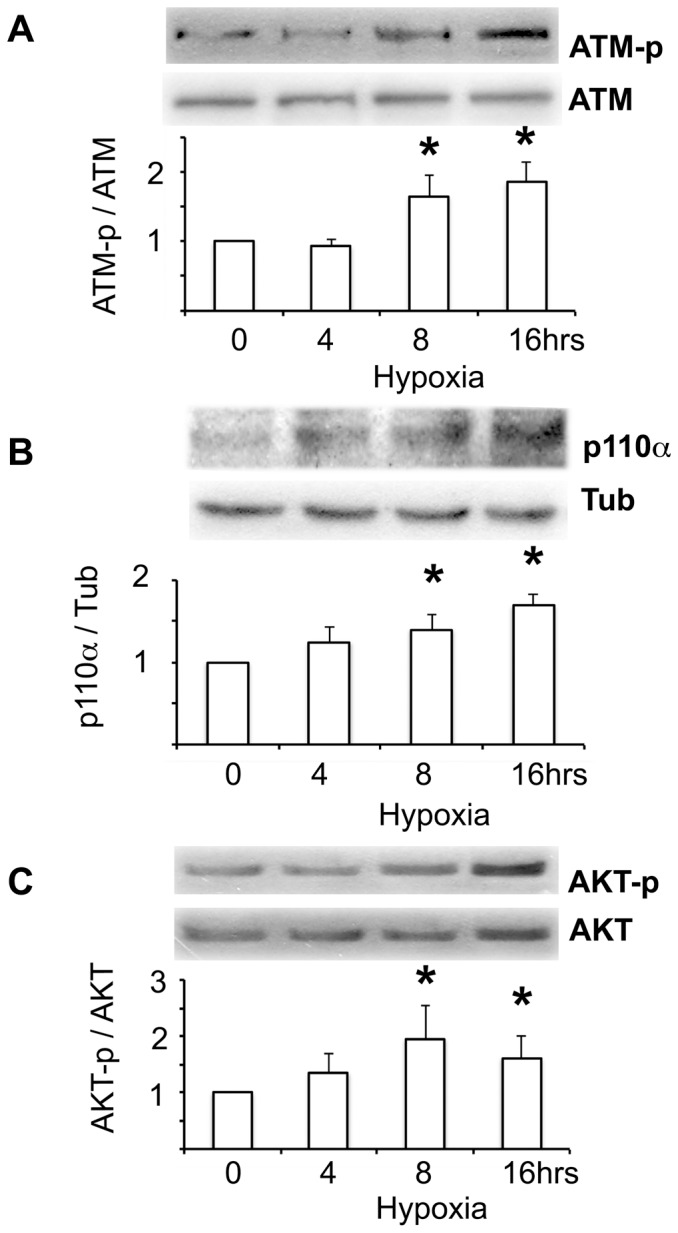
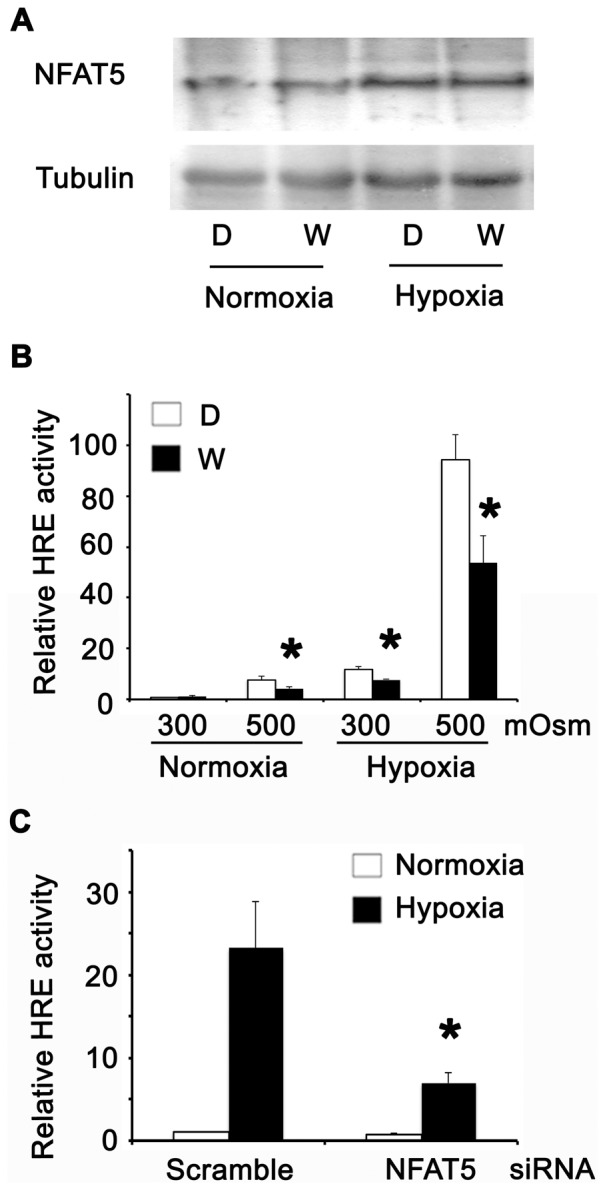
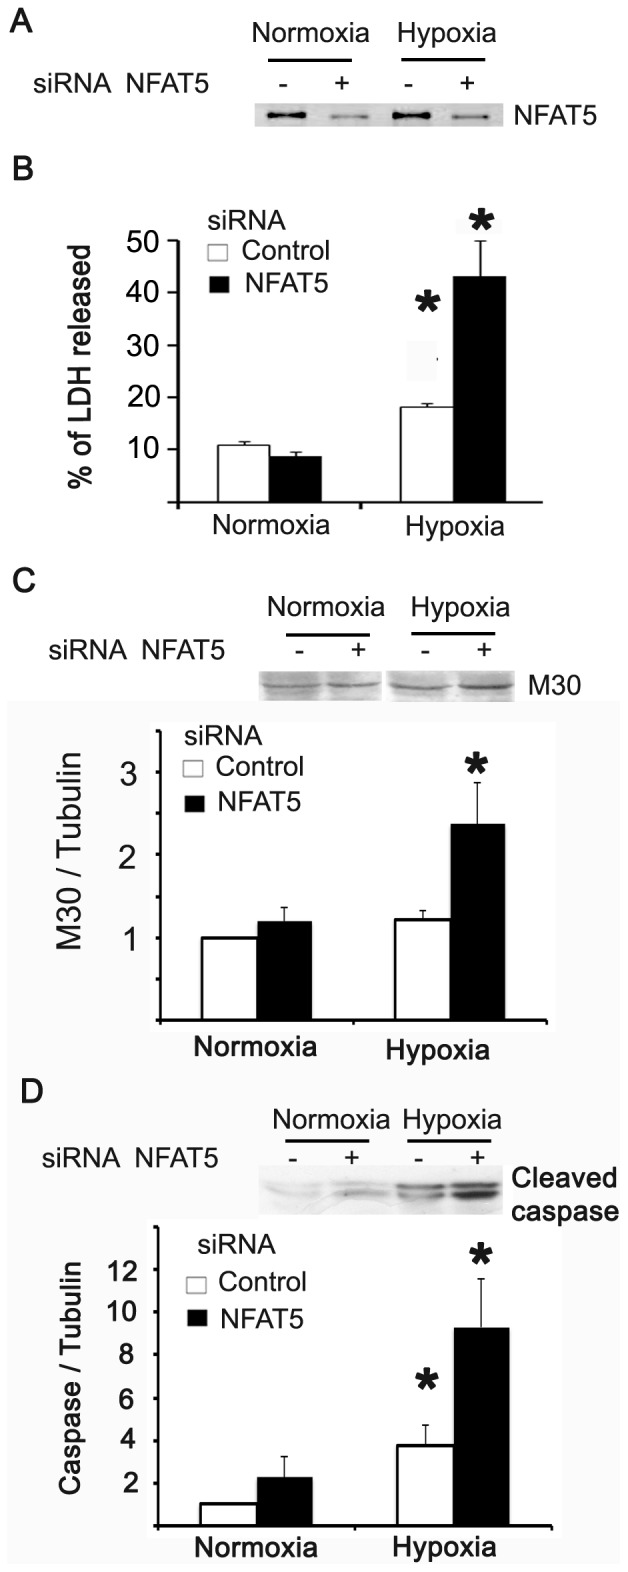
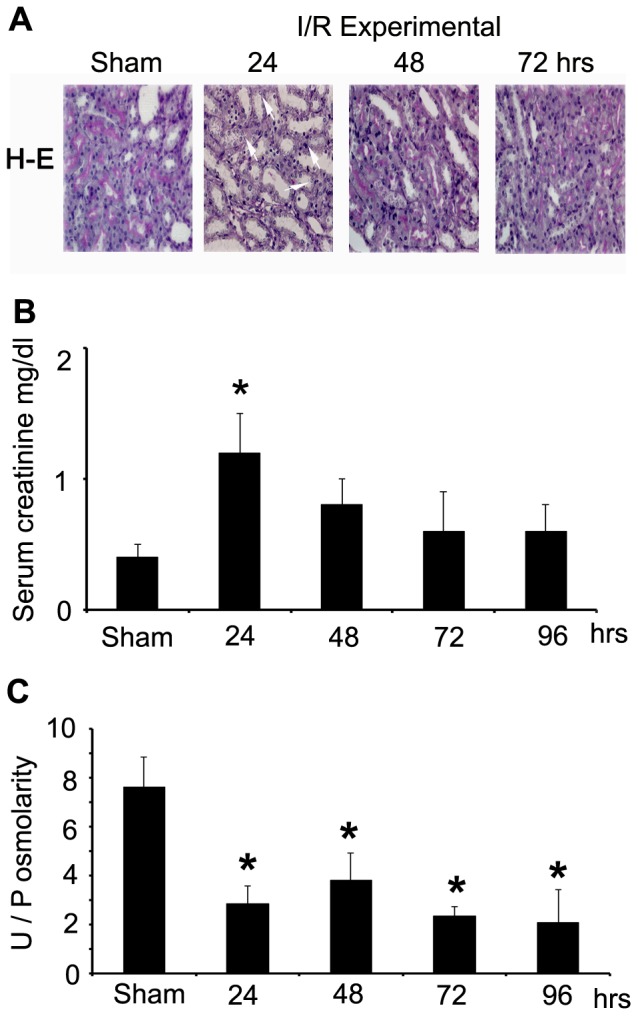
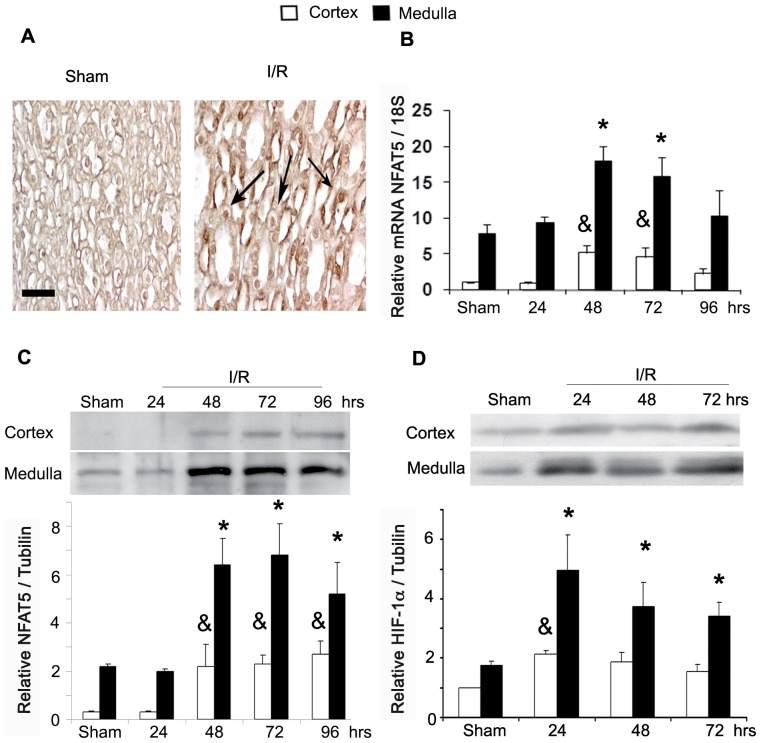
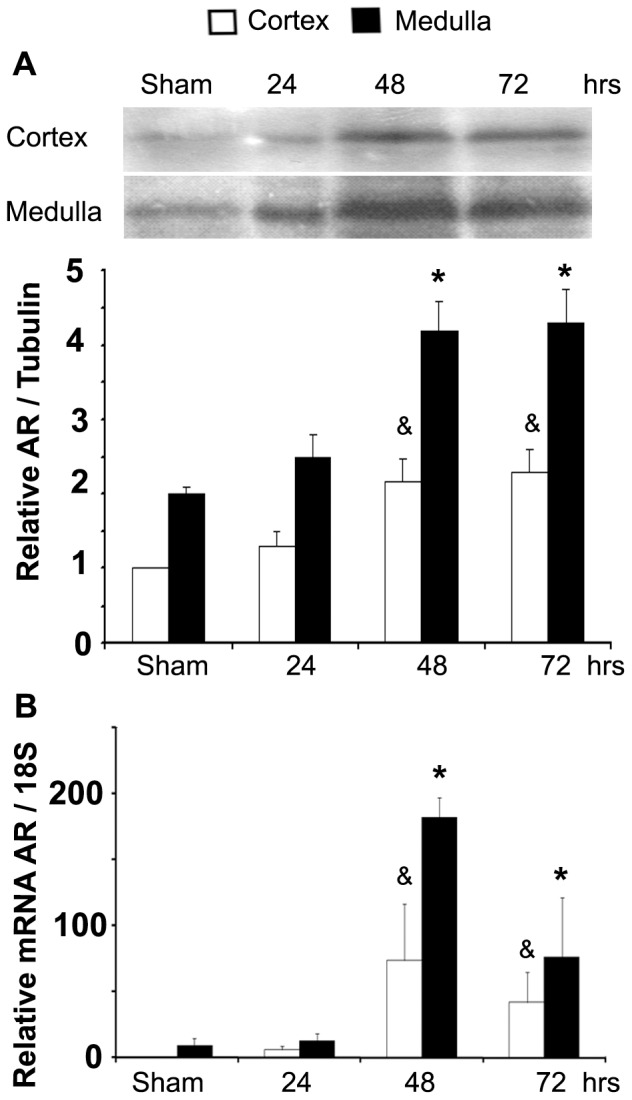
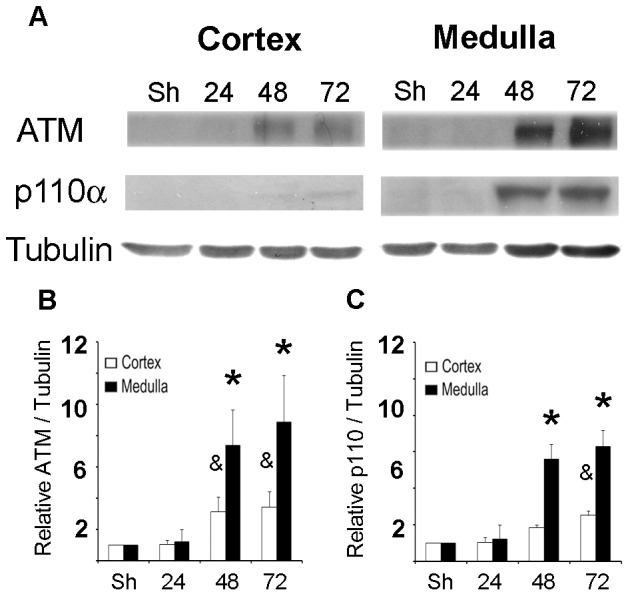
The current hypothesis postulates that NFAT5 activation in the kidney's inner medulla is due to hypertonicity, resulting in cell protection. Additionally, the renal medulla is hypoxic (10-18 mmHg); however there is no information about the effect of hypoxia on NFAT5. Using in vivo and in vitro models, we evaluated the effect of reducing the partial pressure of oxygen (PO(2)) on NFAT5 activity. We found that 1) Anoxia increased NFAT5 expression and nuclear translocation in primary cultures of IMCD cells from rat kidney. 2) Anoxia increased transcriptional activity and nuclear translocation of NFAT5 in HEK293 cells. 3) The dose-response curve demonstrated that HIF-1α peaked at 2.5% and NFAT5 at 1% of O(2). 4) At 2.5% of O(2), the time-course curve of hypoxia demonstrated earlier induction of HIF-1α gene expression than NFAT5. 5) siRNA knockdown of NFAT5 increased the hypoxia-induced cell death. 6) siRNA knockdown of HIF-1α did not affect the NFAT5 induction by hypoxia. Additionally, HIF-1α was still induced by hypoxia even when NFAT5 was knocked down. 7) NFAT5 and HIF-1α expression were increased in kidney (cortex and medulla) from rats subjected to an experimental model of ischemia and reperfusion (I/R). 7) Experimental I/R increased the NFAT5-target gene aldose reductase (AR). 8) NFAT5 activators (ATM and PI3K) were induced in vitro (HEK293 cells) and in vivo (I/R kidneys) with the same timing of NFAT5. 8) Wortmannin, which inhibits ATM and PI3K, reduces hypoxia-induced NFAT5 transcriptional activation in HEK293 cells. These results demonstrate for the first time that NFAT5 is induced by hypoxia and could be a protective factor against ischemic damage.
Conflict of interest statement
Figures
Similar articles
-
Oxygen-dependent expression of hypoxia-inducible factor-1alpha in renal medullary cells of rats.Physiol Genomics. 2001 Aug 28;6(3):159-68. doi: 10.1152/physiolgenomics.2001.6.3.159. Physiol Genomics. 2001. PMID: 11526200
-
Increased NFAT5 expression stimulates transcription of Hsp70 in preeclamptic placentas.Placenta. 2014 Feb;35(2):109-16. doi: 10.1016/j.placenta.2013.12.005. Epub 2013 Dec 21. Placenta. 2014. PMID: 24398013
-
Hypoxia-inducible factors and tubular cell survival in isolated perfused kidneys.Kidney Int. 2006 Jul;70(1):60-70. doi: 10.1038/sj.ki.5000395. Epub 2006 May 17. Kidney Int. 2006. PMID: 16710354
-
Leishmania infantum-chagasi activates SHP-1 and reduces NFAT5/TonEBP activity in the mouse kidney inner medulla.Am J Physiol Renal Physiol. 2014 Sep 1;307(5):F516-24. doi: 10.1152/ajprenal.00006.2014. Epub 2014 Jul 2. Am J Physiol Renal Physiol. 2014. PMID: 24990897
-
Inhibitor of DNA Binding 1 Is Induced during Kidney Ischemia-Reperfusion and Is Critical for the Induction of Hypoxia-Inducible Factor-1α.Biomed Res Int. 2016;2016:4634386. doi: 10.1155/2016/4634386. Epub 2016 Apr 5. Biomed Res Int. 2016. PMID: 27127787 Free PMC article.
Cited by
-
Long Non-coding RNA MIR22HG Alleviates Ischemic Acute Kidney Injury by Targeting the miR-134-5p/NFAT5 axis.Inflammation. 2025 Mar 17. doi: 10.1007/s10753-025-02286-5. Online ahead of print. Inflammation. 2025. PMID: 40095256
-
NFAT5: a stress-related transcription factor with multiple functions in health and disease.Cell Stress. 2025 May 22;9:16-48. doi: 10.15698/cst2025.05.304. eCollection 2025. Cell Stress. 2025. PMID: 40421201 Free PMC article. Review.
-
The nuclear factor of activated T cells 5 (NFAT5) contributes to the renal corticomedullary differences in gene expression.Sci Rep. 2022 Nov 24;12(1):20304. doi: 10.1038/s41598-022-24237-y. Sci Rep. 2022. PMID: 36433977 Free PMC article.
-
NH4Cl Treatment Prevents Tissue Calcification in Klotho Deficiency.J Am Soc Nephrol. 2015 Oct;26(10):2423-33. doi: 10.1681/ASN.2014030230. Epub 2015 Feb 2. J Am Soc Nephrol. 2015. PMID: 25644113 Free PMC article.
-
NFAT5 Is Involved in GRP-Enhanced Secretion of GLP-1 by Sodium.Int J Mol Sci. 2021 Apr 12;22(8):3951. doi: 10.3390/ijms22083951. Int J Mol Sci. 2021. PMID: 33921209 Free PMC article.
References
-
- Sadowski J. Estimation of changes in renal tissue electrolytes from measurements of electrical admittance: application in the rat. Acta Physiol Pol. 1985;36:339–44. - PubMed
-
- Araujo M, Welch Wj. Oxidative stress and nitric oxide in kidney function. Curr Opin Nephrol Hypertens. 2006;15:72–77. - PubMed
-
- Priyadarshi A, Periyasamy S, Burke TJ, Britton SL, Malhotra D, et al. Effects of reduction of renal mass on renal oxygen tension and erythropoietin production in the rat. Kidney Int. 2002;61:542–6. - PubMed
-
- Woo SK, Nahm O, Kwon HM. How salt regulates genes: function of a Rel-like transcription factor NFAT5. Biochem Biophys Res Commun. 2000b;278:269–71. - PubMed
Publication types
MeSH terms
Substances
LinkOut - more resources
Full Text Sources
Other Literature Sources
Research Materials
Miscellaneous
