High-throughput NMR assessment of the tertiary structure of food allergens
- PMID: 22768312
- PMCID: PMC3388089
- DOI: 10.1371/journal.pone.0039785
High-throughput NMR assessment of the tertiary structure of food allergens
Abstract
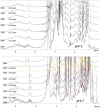
Background: In vitro component-resolved diagnosis of food allergy requires purified allergens that have to meet high standards of quality. These include the authentication of their conformation, which is relevant for the recognition by specific IgE antibodies from allergic patients. Therefore, highly sensitive and reliable screening methods for the analysis of proteins/allergens are required to assess their structural integrity. In the present study one-dimensional 1H Nuclear Magnetic Resonance (1D 1H-NMR) analysis was adopted for the assessment of overall structural and dynamic properties and authentication of a set of relevant food allergens, including non-specific lipid transfer proteins from apple, peach and hazelnut, 7/8S seed storage globulins from hazelnut and peanut, 11S seed storage globulins from hazelnut and peanut, caseins from cows' and goats' milk and tropomyosin from shrimp.
Methodology/principal findings: Two sets of 1D 1H-NMR experiments, using 700 MHz and 600 MHz instruments at 298 K were carried out to determine the presence and the extent of tertiary structure. Structural similarity among members of the individual allergen families was also assessed and changes under thermal stress investigated. The nuclear magnetic resonance (NMR) results were compared with structural information available either from the literature, Protein Data Bank entries, or derived from molecular models.
Conclusions/significance: 1D (1)H-NMR analysis of food allergens allowed their classification into molecules with rigid, extended and ordered tertiary structures, molecules without a rigid tertiary structure and molecules which displayed both features. Differences in thermal stability were also detected. In summary, 1D (1)H-NMR gives insights into molecular fold of proteins and offers an independent method for assessing structural properties of proteins.
Conflict of interest statement
Figures


Similar articles
-
Structural and Functional Characterization of the Hazelnut Allergen Cor a 8.J Agric Food Chem. 2015 Oct 21;63(41):9150-8. doi: 10.1021/acs.jafc.5b03534. Epub 2015 Oct 7. J Agric Food Chem. 2015. PMID: 26417906 Free PMC article.
-
Purification and crystallization of Cor a 9, a major hazelnut allergen.Acta Crystallogr Sect F Struct Biol Cryst Commun. 2009 Jan 1;65(Pt 1):42-6. doi: 10.1107/S1744309108039894. Epub 2008 Dec 25. Acta Crystallogr Sect F Struct Biol Cryst Commun. 2009. PMID: 19153454 Free PMC article.
-
The non-specific lipid transfer protein, Ara h 9, is an important allergen in peanut.Clin Exp Allergy. 2009 Sep;39(9):1427-37. doi: 10.1111/j.1365-2222.2009.03312.x. Epub 2009 Jul 16. Clin Exp Allergy. 2009. PMID: 19624524
-
High pressure effects on allergen food proteins.Biophys Chem. 2013 Dec 15;183:19-29. doi: 10.1016/j.bpc.2013.06.009. Epub 2013 Jun 21. Biophys Chem. 2013. PMID: 23850175 Review.
-
Lipid transfer proteins and 2S albumins as allergens.Allergy. 2001;56 Suppl 67:45-7. doi: 10.1034/j.1398-9995.2001.00914.x. Allergy. 2001. PMID: 11298008 Review.
Cited by
-
Natural Variation of Hazelnut Allergenicity: Is There Any Potential for Selecting Hypoallergenic Varieties?Nutrients. 2020 Jul 16;12(7):2100. doi: 10.3390/nu12072100. Nutrients. 2020. PMID: 32708541 Free PMC article.
-
Applications of Molecular Diagnostic Testing in Food Allergy.Curr Allergy Asthma Rep. 2015 Sep;15(9):56. doi: 10.1007/s11882-015-0557-6. Curr Allergy Asthma Rep. 2015. PMID: 26233429 Free PMC article. Review.
-
Diagnosing allergic sensitizations in the third millennium: why clinicians should know allergen molecule structures.Clin Transl Allergy. 2017 Jul 17;7:21. doi: 10.1186/s13601-017-0158-7. eCollection 2017. Clin Transl Allergy. 2017. PMID: 28725346 Free PMC article. Review.
-
Molecular Profiling of Peanut under Raw, Roasting, and Autoclaving Conditions Using High-Resolution Magic Angle Spinning and Solution 1H NMR Spectroscopy.Molecules. 2023 Dec 27;29(1):162. doi: 10.3390/molecules29010162. Molecules. 2023. PMID: 38202743 Free PMC article.
-
A Response Surface Methodology (RSM) Approach for Optimizing the Attenuation of Human IgE-Reactivity to β-Lactoglobulin (β-Lg) by Hydrostatic High Pressure Processing.Foods. 2021 Jul 28;10(8):1741. doi: 10.3390/foods10081741. Foods. 2021. PMID: 34441519 Free PMC article.
References
-
- Hoffmann-Sommergruber K, Mills EN. Food allergen protein families and their structural characteristics and application in component-resolved diagnosis: new data from the EuroPrevall project. Anal Bioanal Chem. 2009;395:25–35. - PubMed
-
- Nicolaou N, Poorafshar M, Murray C, Simpson A, Winell H, et al. Allergy or tolerance in children sensitized to peanut: prevalence and differentiation using component-resolved diagnostics. J Allergy Clin Immunol. 2010;125:191–197. - PubMed
-
- Hansen KS, Ballmer-Weber BK, Sastre J, Lidholm J, Andersson K, et al. Component-resolved in vitro diagnosis of hazelnut allergy in Europe. J Allergy Clin Immunol. 2009;123:1134–1141. - PubMed
-
- Bublin M, Pfister M, Radauer C, Oberhuber C, Bulley S, et al. Component-resolved diagnosis of kiwifruit allergy with purified natural and recombinant kiwifruit allergens. J Allergy Clin Immunol. 2011;125:687–694. - PubMed
-
- Hoffmann-Sommergruber K, Mills EN, Vieths S. Coordinated and standardized production, purification and characterization of natural and recombinant food allergens to establish a food allergen library. Mol Nutr Food Res. 2008;52(Suppl 2):S159–165. - PubMed
Publication types
MeSH terms
Substances
Grants and funding
LinkOut - more resources
Full Text Sources

