. 2012;7(7):e40145.
doi: 10.1371/journal.pone.0040145. Epub 2012 Jul 2.

A pro-cathepsin L mutant is a luminal substrate for endoplasmic-reticulum-associated degradation in C. elegans

Affiliations

A pro-cathepsin L mutant is a luminal substrate for endoplasmic-reticulum-associated degradation in C. elegans

Mark T Miedel et al. PLoS One. 2012.

Abstract

Endoplasmic-reticulum associated degradation (ERAD) is a major cellular misfolded protein disposal pathway that is well conserved from yeast to mammals. In yeast, a mutant of carboxypeptidase Y (CPY*) was found to be a luminal ER substrate and has served as a useful marker to help identify modifiers of the ERAD pathway. Due to its ease of genetic manipulation and the ability to conduct a genome wide screen for modifiers of molecular pathways, C. elegans has become one of the preferred metazoans for studying cell biological processes, such as ERAD. However, a marker of ERAD activity comparable to CPY* has not been developed for this model system. We describe a mutant of pro-cathepsin L fused to YFP that no longer targets to the lysosome, but is efficiently eliminated by the ERAD pathway. Using this mutant pro-cathepsin L, we found that components of the mammalian ERAD system that participate in the degradation of ER luminal substrates were conserved in C. elegans. This transgenic line will facilitate high-throughput genetic or pharmacological screens for ERAD modifiers using widefield epifluorescence microscopy.


Conflict of interest statement

Competing Interests: The authors have declared that no competing interests exist.

Figures

Figure 1
Figure 1. Mutations in the prepro-domain of CPL (CPL-1W32A;Y35A) cause ER accumulation and prevent trafficking to the lysosome.
(A) Alignment of the primary amino acid sequence from C. elegans (Cel) CPL-1[NP_507199.1] with human (Hsa) cathepsins K [AAH16058.1] (CATK), L [NP_666023.1] (CATL), S [AAC37592.1] (CATS) and V [BAA25909.1] (CATV) using the ClustalW algorithm. Blue shading indicates the three tryptophan residues within the human CATL-like prepro-domain that are critical for proper folding . Arrowheads indicate the residues mutated to alanines in the CPL-1 sequence to generate CPL-1W32A;Y35A::YFP. [ ] denote accession numbers of individual amino acid sequences used in alignments. (B) Schematic representation of the expression constructs used to express either wild-type or mutant CPL-1::YFP. The asterisks denote location of the mutated resides within the prepro-domain (green line). The intron locations were not depicted. (C–J) Transgenic animals expressing CPL-1::YFP (C–F) or CPL-1W32A;Y35A::YFP (G–J) were examined by confocal microscopy and maximum intensity projections are displayed. Both lines were also co-injected with a DsRed::KDEL transgene to mark the ER (D, H), and were also incubated with BSA::AlexaFluor647 to label the endo-lysosomal compartment (E, I). CPL-1::YFP showed a punctate distribution within intestinal cells (C) that co-localized with BSA::AlexaFluor647 (E, F), but did not overlap with DsRed::KDEL (D). This pattern suggested CPL-1::YFP was trafficking correctly to the endolysosomal compartment. In contrast, CPL-1W32A;Y35A::YFP displayed a fine reticular pattern (G, inset) with a few intracellular inclusions (G, arrowheads) that co-localized with the DsRed::KDEL ER marker (H and J), but not the BSA::AlexaFluor647 endo-lysosomal marker (I). Insets of single z plane images are included to highlight the distinct reticular fluorescence pattern displayed by the DsRed::KDEL ER marker and the YFP fluorescence pattern observed in animals expressing CPL-1W32A;Y35A::YFP. Scale bar represents 10 µm.
Figure 2
Figure 2. CPL-1 and CPL-1W32A;Y35A protein and mRNA expression.
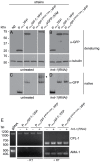
(A–D) Immunoblots of total protein lysates derived from wild-type (N2) or transgenic strains that were unexposed (A, C) or exposed to hrd-1(RNAi) (B, D). Protein lysates, separated by either SDS- (A–B) or native PAGE (C–D), were immunoblotted with anti-GFP polyclonal antisera that detects both YFP and GFP. Furthermore, the membranes from the SDS-PAGE were stripped and re-probed with α-tubulin monoclonal antibody to control for protein loading. Unlike CPL-1::YFP, was CPL-1W32A;Y35A::YFP was detected under denaturing (and native gel) conditions only after ERAD inhibition by hrd-1(RNAi). As compared to the polymerizing GFP::ATM control (arrowhead), neither CPL-1 protein appeared to form higher order polymers as detected by native PAGE. (E) Steady-state CPL-1 mRNA (514 bp) levels. Total RNA isolated from 350 Pnhx-2cpl-1::YFP;Pmyo-2mCherry or Pnhx-2cpl-1W32AY35A::YFP;Pmyo-2mCherry transgenic animals, treated with either vector or hrd-1(RNAi), was assessed by reverse transcriptase (RT) PCR (RT-PCR). No RT, genomic DNA (gDNA) template and primers for a housekeeping cDNA, AMA-1, (425 bp) served as controls. Diluted CPL-1 mRNA levels derived from the different transgenic strains were comparable.
Figure 3
Figure 3. Workflow used to identify changes in CPL-1W32A;Y35A::YFP accumulation after exposure to different RNAi treatments.
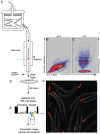
(A–C) Synchronized animals were collected in the COPAS Biosort sample cup (A) and passed through a flow cell, where L4 staged animals were gated by a combination of extinction coefficient and time of flight (TOF) (B). A subset of the gated L4 animals was selected on the basis of red fluorescence and TOF (sorted region) through the flow cell (C). (D) Selected animals were dispensed onto NGM plates seeded with E. coli expressing double stranded RNAs. (E) After 48 hours, animals were collected and dispensed into a 384-well optical bottom plate for fluorescence quantification using the ArrayScan VTi automated microscope and analysis system. (F) The number of animals in each well were counted by using the mCherry head marker (red) to identify individual animals while the GFP channel was used to identify the number, intensity and size of the CPL-1W32A;Y35A::YFP accumulations (green). The total area of CPL-1W32A;Y35A::YFP accumulations per worm was calculated by dividing the total area of YFP fluorescence by the total number of mCherry heads identified in each well. Fold-increases values were determined by normalizing to the vector RNAi in order to account for day-to-day variations in transgene expression levels. The experiments were performed in triplicate and displayed as an average of the three trials ± the standard error of the mean (SEM).
Figure 4
Figure 4. CPL-1W32A;Y35A::YFP accumulated after knockdown of ERAD components.
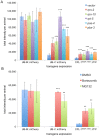
(A) Either Pnhx-2cpl-1::YFP;Pmyo-2mCherry or Pnhx-2cpl-1W32AY35A::YFP;Pmyo-2mCherry animals were treated with RNAi and analyzed as described in Figure 3. Statistical analysis of the RNAi treated animals relative to vector was performed using an unpaired, 2-tailed t-test (unequal variance) (*p<0.05, **p<0.01, ***p<0.001). (B–P) Pnhx-2cpl-1W32AY35A::YFP;Pmyo-2mCherry;DsRed::KDEL animals were exposed to vector (B–D), GFP (E–G), cdc-48 (H–J), hrd-1 (K–M) or sel-1 (N–P) RNAi for 48 h. and images were collected using a widefield epifluorescence microscope. The arrowheads indicate accumulations of CPL-1W32A;Y35A, which co-localized with the ER marker, DsRed::KDEL. Scale bar indicates 100 µm.
Figure 5
Figure 5. CPL-1W32A;Y35A::YFP accumulation after proteasomal inhibition.
UB-M::mCherry, UB-V::mCherry, or CPL-1W32A;Y35A::YFP expressing transgenic animals were exposed to either a proteasomal RNAi panel (A) or chemical inhibitors (B). Animals were processed as described in Figure 3. For the UB-M::mCherry and UB-V::mCherry expressing animals, the algorithm was adjusted to detect the entire intestinal fluorescence pattern above that of the vector(RNAi) control. Total intensity was used in place of total area. Statistical analysis of the RNAi treated animals relative to vector was performed using an unpaired, 2-tailed t-test (unequal variance) (**p<0.01, ***p<0.001). Both proteasomal RNAi and chemical inhibitors caused a significant increase in in CPL-1W32A;Y35A::YFP fluorescence.
Figure 6
Figure 6. Autophagy inhibition did not affect steady-state levels of CPL-1W32A;Y35A::YFP.
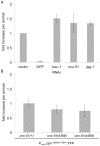
(A) CPL-1W32A;Y35A::YFP animals were exposed to an autophagy RNAi panel and analyzed as described in Figure 3. Statistical analysis of the RNAi treated animals relative to vector was performed using an unpaired, 2 tailed t-test (unequal variance). No significant difference was observed. (B) VK1879 (N2;vkEx1879[Pnhx-2cpl-1W32AY35A::YFP;Pmyo-2mCherry]) animals were crossed with the autophagy-deficient knockout strain unc-51(e369) to derive unc-51(e369);vkEx1879[Pnhx-2cpl-1W32AY35A::YFP;Pmyo-2mCherry]. Two individual lines (VK1984 and VK1985) were selected and analyzed as described in Figure 3. Results were compared to those obtained in the original CPL-1W32A;Y35A::YFP strain. No significant difference in CPL-1W32A;Y35A::YFP expression was observed in the autophagy deficient strains.
Figure 7
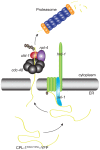
Figure 7. Schematic representation of CPL-1W32A;Y35A::YFP degradation by ERAD.
Misfolded CPL-1W32A;Y35A::YFP is recognized and targeted to the hrd-1/sel-1 complex where it is ubiquitinated. Following polyubiquitination CPL-1W32A;Y35A::YFP is retro-translocated by the CDC-48NPL-4/UFD-1 complex and degraded by the proteasome.

References

    1. Balch WE, Morimoto RI, Dillin A, Kelly JW. Adapting proteostasis for disease intervention. Science. 2008;319:916–919. - PubMed
    1. Powers ET, Morimoto RI, Dillin A, Kelly JW, Balch WE. Biological and chemical approaches to diseases of proteostasis deficiency. Annu Rev Biochem. 2009;78:959–991. - PubMed
    1. Roth DM, Balch WE. Modeling general proteostasis: proteome balance in health and disease. Curr Opin Cell Biol. 2011;23:126–134. - PMC - PubMed
    1. Vembar SS, Brodsky JL. One step at a time: endoplasmic reticulum-associated degradation. Nat Rev Mol Cell Biol. 2008;9:944–957. - PMC - PubMed
    1. Hoseki J, Ushioda R, Nagata K. Mechanism and components of endoplasmic reticulum-associated degradation. J Biochem. 2010;147:19–25. - PubMed

Publication types

MeSH terms

LinkOut - more resources