. 2012 May 31;1(5):424-33.
doi: 10.1016/j.celrep.2012.04.001.

Translational control of cell division by Elongator

Affiliations

Translational control of cell division by Elongator

Fanelie Bauer et al. Cell Rep. .

Abstract

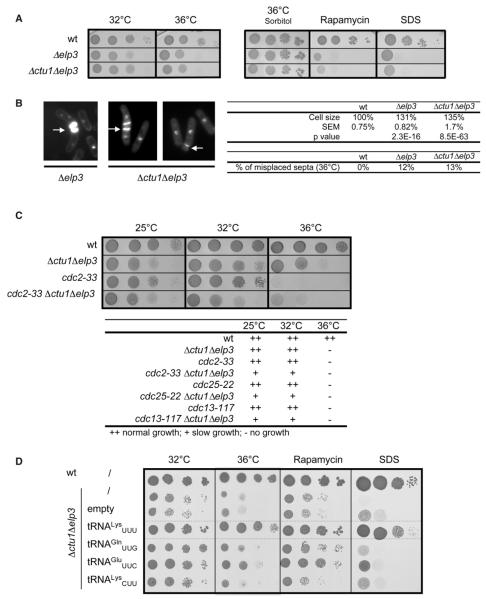
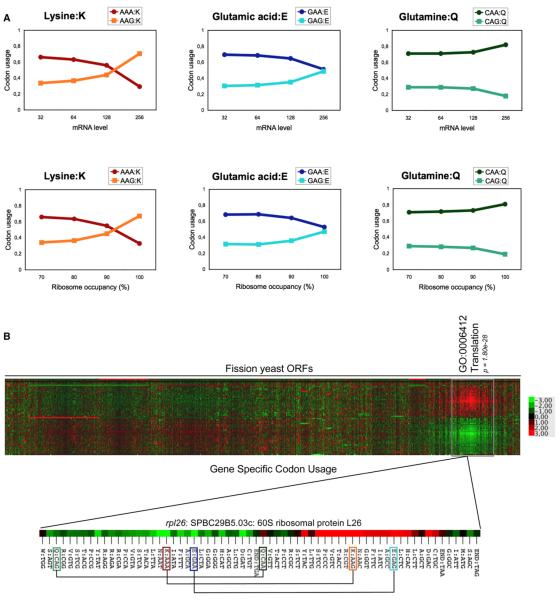
Elongator is required for the synthesis of the mcm(5)s(2) modification found on tRNAs recognizing AA-ending codons. In order to obtain a global picture of the role of Elongator in translation, we used reverse protein arrays to screen the fission yeast proteome for translation defects. Unexpectedly, this revealed that Elongator inactivation mainly affected three specific functional groups including proteins implicated in cell division. The absence of Elongator results in a delay in mitosis onset and cytokinesis defects. We demonstrate that the kinase Cdr2, which is a central regulator of mitosis and cytokinesis, is under translational control by Elongator due to the Lysine codon usage bias of the cdr2 coding sequence. These findings uncover a mechanism by which the codon usage, coupled to tRNA modifications, fundamentally contributes to gene expression and cellular functions.


Figures

Figure 1
Figure 1. The Absence of the mcm5s2 Modification Leads to Specific Phenotypes Suppressed by Overexpression of the Unmodified tRNALysUUU
(A) Spot dilution assay of wt, Δelp3 and Δctu1Δelp3 strains grown on rich media at 32°C or 36°C, or supplemented with 1 M sorbitol, 5 ng/ml rapamycin, or 0.005% SDS. (B) Left panel: DAPI and calcofluor stained Δelp3 or Δctu1Δelp3 cells grown at 36°C. Right panel: measurement of septated cell size (reported to wild-type = 100%; p value by Student’s t test; n > 100) and counting of misplaced septa (n > 100) in the Δelp3 and Δctu1Δelp3 strains. (C) Spot dilution assay of wt, Δctu1Δelp3, cdc2-33 and Δctu1 Δelp3 cdc2-33 grown on rich media at 25°C, 32°C, or 36°C and a summary of similar interactions with the cdc25-22 and cdc13-117 alleles. (D) Spot dilution assay of the Δctu1Δelp3 strain expressing elevated levels of tRNALysUUU, tRNAGlnUUG, tRNAGluUUC, or tRNALysCUU on indicated selective minimal media. See also Figures S1 and S2.
Figure 2
Figure 2. Highly Expressed Fission Yeast Genes Use a Skewed Codon Content Excluding the AAA and GAA Codons
(A) Codon bias between G- and A-ending codons for lysine, glutamic acid, and glutamine in genes as a function of mRNA level (upper panel) or ribosome occupancy (lower panel). The data sets used are from a previous study (Lackner et al., 2007). (B) Hierarchical clustering and heat map analysis of the gene-specific codon usage for each codon (rows) in each S. pombe ORF (column). Clustering was performed based on Z-scores shown in Table S1. Deviations from genome average are shown for each codon according to the color-code key. One main cluster is highlighted and is enriched for the “Translation” GO category that includes highly expressed genes. The codon usage of the rpl26 gene (rotated) exemplifies a skewed codon content for lysine and glutamic acid.
Figure 3
Figure 3. Proteome-wide Analysis of Strains Lacking tRNA Modifications by Reverse Protein Arrays
(A) Hierarchical clustering and heat map analysis of the proteome expression level in the Δctu1 and Δelp3 strains compared to wild-type. The data are presented as log2 mutant/wild-type ratio of immunoblotting signals and are color-coded as indicated in the key. (B) Left panel: protein expression profiling in the Δelp3 mutant. Scatter plot of protein expression changes between mutant and the wild-type: signals above the red line are increased in the mutant relative to wild-type, whereas signals below the green line are decreased with a 2-fold cutoff. The proteins whose expression is significantly decreased are reported in Table S2. Right panel: Enriched GO groups are listed with their accession number, name and associated p value(see Experimental Procedures). (GO:0009267, n = 70; GO:0031929, n = 56; GO:0031048, n = 14; GO:0030702, n = 56; GO:0030466, n = 37; GO:0031047, n = 24; GO:0010389, n = 16; GO:0051325, n = 106; GO:0010972, n = 36; GO:0071341, n = 6). (C) Average expression level of the proteome in the Δelp3 strain compared to wt set to 100%. Average expression level within four GO functional groups significantly more affected than the average in the absence of the double modification (*p < 0.05; **p < 0.01, Student’s t test). Expression level of the Cdr2 protein in the Δelp3 strain. (D–F) Codon usage for lysine (AAA-AAG), glutamic acid (GAA-GAG), and glutamine (CAA-CAG) within the same groups shown in (C), and the Cdr2 protein. The ORFeome codon usage is indicated by the black line. Note that the 0%–20% and 40%–100% of the y axis are not shown to highlight variations from the ORFeome codon usage. (*p < 0.05; **p < 0.01; ***p < 0.001, Student’s t test). See also Figure S3.
Figure 4
Figure 4. The Cdr2 Kinase Is Regulated Translationally by Elongator-Dependent tRNALysUUU Modification
(A) Quantitative analysis of cdr2 mRNA and Cdr2-HA or HA-Cdr2 protein abundance in a wt or Δctu1Δelp3 strains tagged at chromosomal locus. Error bars represent the SEM of biological triplicates. (B) Western blot analysis of plasmid born Cdr2-HA in wt or Δctu1Δelp3 strains expressing elevated level of tRNALysUUU, tRNAGlnUUG, tRNAGluUUC, or tRNALysCUU. Tubulin was used as a loading control and quantification was performed with a LI-COR scanner (see Experimental Procedures). The value from the wild-type strain transformed with an empty vector was set to 1. (C) Western blot analysis of plasmid born Cdr2-HA, or Cdr2-HAno-AAA in wt or Δctu1Δelp3 strains. Tubulin was used as a loading control and quantification was performed with a LI-COR scanner (see Experimental Procedures). The value from the wild-type strain was set to 1. (D) Measure of septated cell size (reported to wild-type = 100%; SEM = standard error of the mean; n > 100; p value obtained from Student’s t test) and counting of misplaced septa (n > 100) in wt, Δcdr2, Δctu1Δelp3, and Δctu1Δelp3Δcdr2 grown at 36°C. (E) Hierarchical clustering and heat map analysis of the protein expression level of the gene ontology group “Regulation of the G2-M transition of the mitotic cell cycle” (GO 0010389) in the Δctu1 and Δelp3 strain compared to wild-type. The data are presented as log2 mutant/wild-type ratio of hybridization signals and are color-coded as in Figure 3A. See also Figure S4.

References

    1. Agris PF, Vendeix FA, Graham WD. tRNA’s wobble decoding of the genome: 40 years of modification. J. Mol. Biol. 2007;366:1–13. - PubMed
    1. Ashraf SS, Sochacka E, Cain R, Guenther R, Malkiewicz A, Agris PF. Single atom modification (O/S) of tRNA confers ribosome binding. RNA. 1999;5:188–194. - PMC - PubMed
    1. Bamps S, Westerling T, Pihlak A, Tafforeau L, Vandenhaute J, Mäkelä TP, Hermand D. Mcs2 and a novel CAK subunit Pmh1 associate with Skp1 in fission yeast. Biochem. Biophys. Res. Commun. 2004;325:1424–1432. - PubMed
    1. Begley U, Dyavaiah M, Patil A, Rooney JP, DiRenzo D, Young CM, Conklin DS, Zitomer RS, Begley TJ. Trm9-catalyzed tRNA modifications link translation to the DNA damage response. Mol. Cell. 2007;28:860–870. - PMC - PubMed
    1. Björk GR. Biosynthesis and function of modified nucleosides. In: D. S, RajBhandary U, editors. tRNA: Structure, Biosynthesis, and Foundation. American Society for Microbiology; Washington, DC: 1995. pp. 165–205.

Publication types

MeSH terms