. 2012 Apr 18;102(8):1712-21.
doi: 10.1016/j.bpj.2012.01.058.

Competition between small RNAs: a quantitative view

Affiliations

Competition between small RNAs: a quantitative view

Adiel Loinger et al. Biophys J. .

Abstract

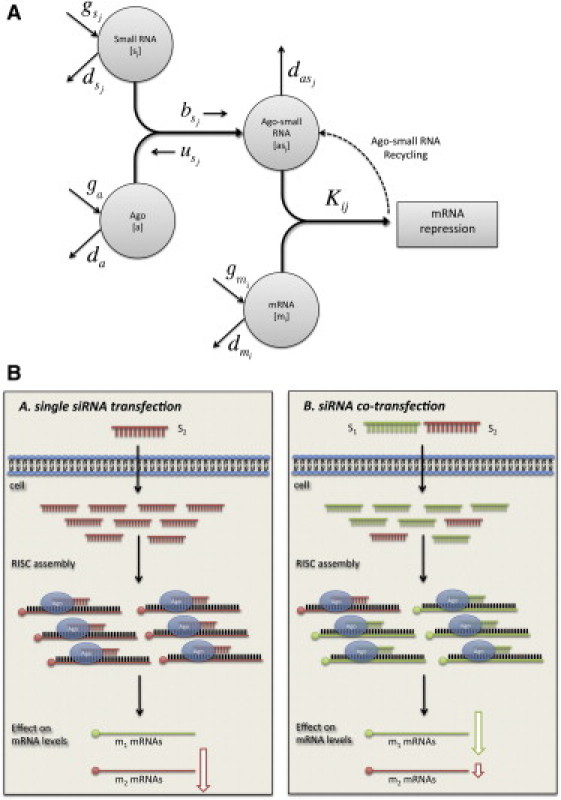
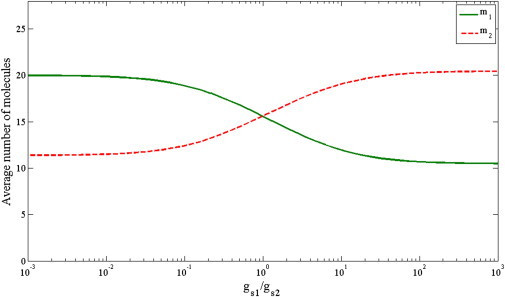
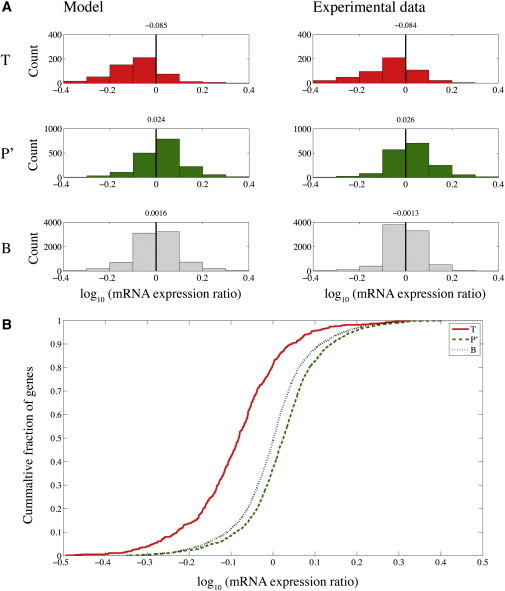
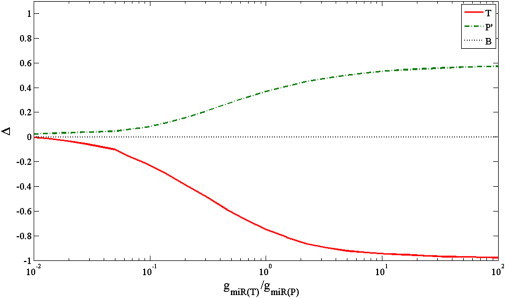
Two major classes of small regulatory RNAs--small interfering RNAs (siRNAs) and microRNA (miRNAs)--are involved in a common RNA interference processing pathway. Small RNAs within each of these families were found to compete for limiting amounts of shared components, required for their biogenesis and processing. Association with Argonaute (Ago), the catalytic component of the RNA silencing complex, was suggested as the central mechanistic point in RNA interference machinery competition. Aiming to better understand the competition between small RNAs in the cell, we present a mathematical model and characterize a range of specific cell and experimental parameters affecting the competition. We apply the model to competition between miRNAs and study the change in the expression level of their target genes under a variety of conditions. We show quantitatively that the amount of Ago and miRNAs in the cell are dominant factors contributing greatly to the competition. Interestingly, we observe what to our knowledge is a novel type of competition that takes place when Ago is abundant, by which miRNAs with shared targets compete over them. Furthermore, we use the model to examine different interaction mechanisms that might operate in establishing the miRNA-Ago complexes, mainly those related to their stability and recycling. Our model provides a mathematical framework for future studies of competition effects in regulation mechanisms involving small RNAs.


Figures

Figure 1
Figure 1
Schematic description of the competition between small RNAs. (A) Schematic drawing showing all variables and parameters used in the model to describe the competition between small RNAs. The model takes into account the copy number of small RNAs, mRNAs, and Ago proteins with specific generation and degradation rate for each. An Ago protein can bind a small RNA to generate an Ago-small RNA complex, depending on the association and dissociation rates between the two. The Ago-small RNA complex can bind mRNA target with specific binding rate and induces mRNA degradation. The Ago-small RNA complex can be degraded after zero or one round of activity or can be recycled and regulate several mRNAs. (B) Schematic drawing of the effect of competition between two cotransfected siRNAs on their single target gene expression levels. When only a single siRNA is transfected (left, s2, red), it binds Ago and downregulates its target gene (m2). When an additional siRNA is cotransfected (right, s1, green), it can saturate the system, hence preventing the other siRNA from binding Ago. As a result, less downregulation of the perturbed siRNA target gene (m2) is expected.
Figure 2
Figure 2
Results for a minimalistic model of two competing small RNAs. In this minimal model, each small RNA has one target mRNA. Shown are the average numbers of target mRNA molecules as a function of the ratio of the generation rates of the small RNAs controlling them (X axis in log scale). As the generation rate of the trigger s1 increases, the level of its target mRNA m1 decreases, whereas the level of the perturbed mRNA m2 increases.
Figure 3
Figure 3
Transfection of miRNA results in downregulation of its targets and upregulation of targets of endogenous miRNAs, due to competition for Ago binding. The model captures the principal characteristics of the competition. (A) Histograms of log expression fold change, defined in Eq. 2, for transfection experiment of hsa-miR-124 (right) and model (left). Changes in expression in three sets of genes are presented: T, targets of trigger miRNA (top panel), P′, targets of perturbed miRNAs (middle panel, only targets that do not overlap T targets are included), and B, background (bottom panel, genes that are not targets of either miRNA). The average log mRNA expression ratio is presented above each histogram. (B) Cumulative distribution function for T, P′, and B sets produced by the model. The plot shows statistically significant downregulation by Kolmogorov-Smirnov test of T set (p-value = 10−51) and statistically significant upregulation of P′ set (p-value = 10−27) relative to the B set.
Figure 4
Figure 4
Effect of the trigger miRNA generation rate on the expression level of T, P′, and B gene sets. The X axis is the ratio between the generation rates of trigger miRNA and total perturbed miRNAs (miR-T/miR-P, log scale). The Y axis shows the change in expression level as represented by Δ, the difference between the fractions of upregulated and downregulated genes in a set. The background genes show Δ of zero, as their fractions of upregulated and downregulated genes are equal. As the generation rate of the trigger increases, more of its target genes (T) are downregulated (Δ < 0), and more of the perturbed target genes (P′) are upregulated (Δ > 0). For a very large amount of trigger, all of its target genes are downregulated, whereas the upregulation of the perturbed target genes saturates at a lower level. The results are based on averaging 10 runs, where the generation rate of Ago was equal to the total generation rate of the perturbed miRNAs.
Figure 5
Figure 5
Effect of Ago generation rate on the expression level of T, P′, and B groups. The X axis shows the ratio between Ago generation rate and the generation rate of total perturbed miRNAs (Ago/miR-P, log scale). The Y axis shows the change in expression level as represented by Δ, the difference between the fractions of upregulated and downregulated genes in a set. (A) As the amount of Ago increases, more trigger target genes (T) are downregulated (Δ < 0). For the perturbed target genes (P′), increasing the Ago amount first leads to upregulation (Δ > 0), but at some point the upregulation become less dominant and even turns to downregulation (Δ < 0). The results are based on averaging 10 runs with miR-T/miR-P = 1. (B) Results of simulations that did not include the common target genes of the perturbed and trigger miRNAs. Excluding the common target genes from the simulation abolished the observed downregulation of the perturbed targets genes (P′) under high Ago amounts. Thus, the phenomenon observed in panel A is due to competition on targets between the trigger and perturbed miRNAs under high Ago amount. When the level of trigger miRNA is high it targets the common targets, while the endogenous miRNAs are free to target additional mRNAs, resulting in overall downregulation of their targets.

References

    1. Peters L., Meister G. Argonaute proteins: mediators of RNA silencing. Mol. Cell. 2007;26:611–623. - PubMed
    1. Rivas F.V., Tolia N.H., Joshua-Tor L. Purified Argonaute2 and an siRNA form recombinant human RISC. Nat. Struct. Mol. Biol. 2005;12:340–349. - PubMed
    1. Liu J., Carmell M.A., Hannon G.J. Argonaute2 is the catalytic engine of mammalian RNAi. Science. 2004;305:1437–1441. - PubMed
    1. McManus M.T., Haines B.B., Sharp P.A. Small interfering RNA-mediated gene silencing in T lymphocytes. J. Immunol. 2002;169:5754–5760. - PubMed
    1. Hutvágner G., Simard M.J., Zamore P.D. Sequence-specific inhibition of small RNA function. PLoS Biol. 2004;2:E98. - PMC - PubMed

Publication types

LinkOut - more resources