

Phase diagram of ternary cholesterol/palmitoylsphingomyelin/palmitoyloleoyl-phosphatidylcholine mixtures: spin-label EPR study of lipid-raft formation
- PMID: 22768941
- PMCID: PMC3328704
- DOI: 10.1016/j.bpj.2012.03.043
Phase diagram of ternary cholesterol/palmitoylsphingomyelin/palmitoyloleoyl-phosphatidylcholine mixtures: spin-label EPR study of lipid-raft formation
Abstract
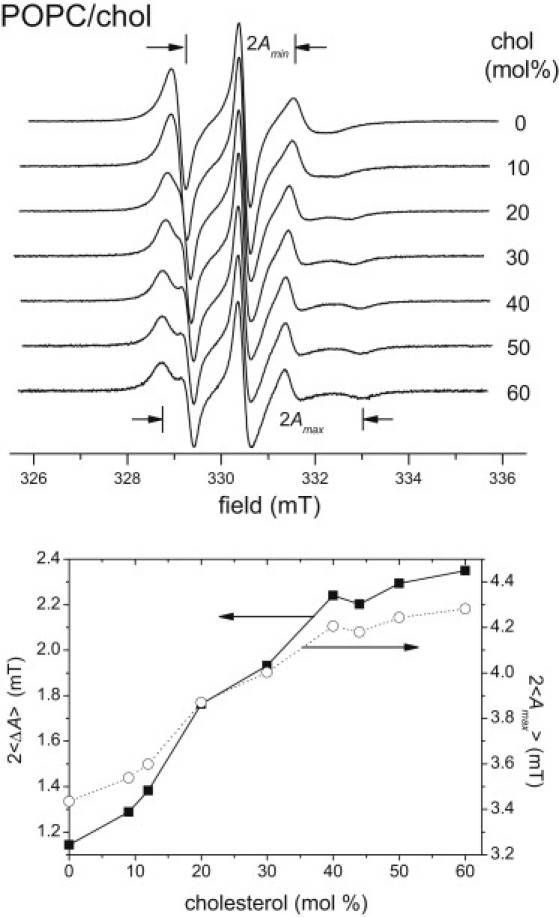
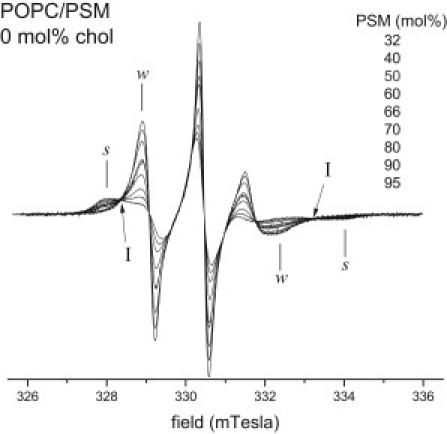
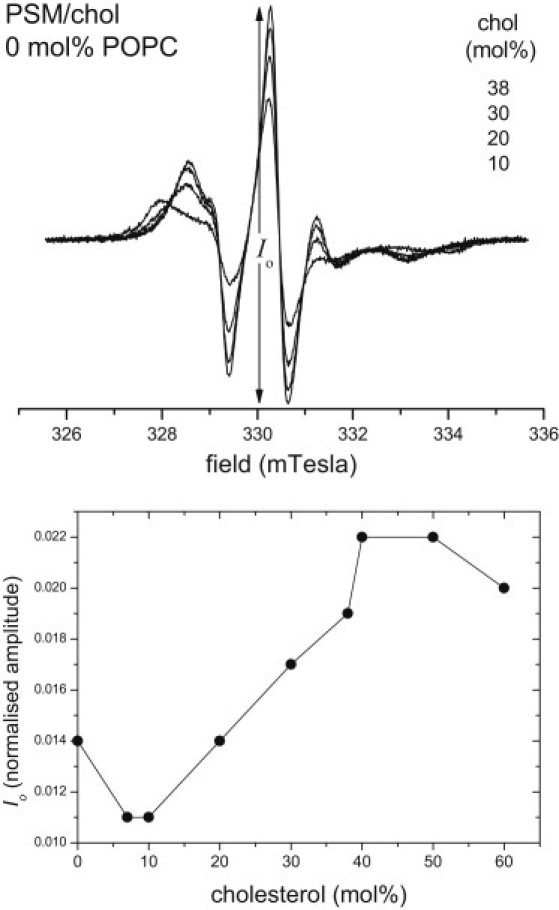
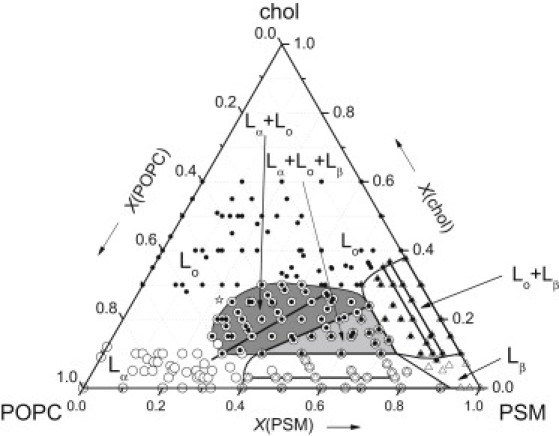
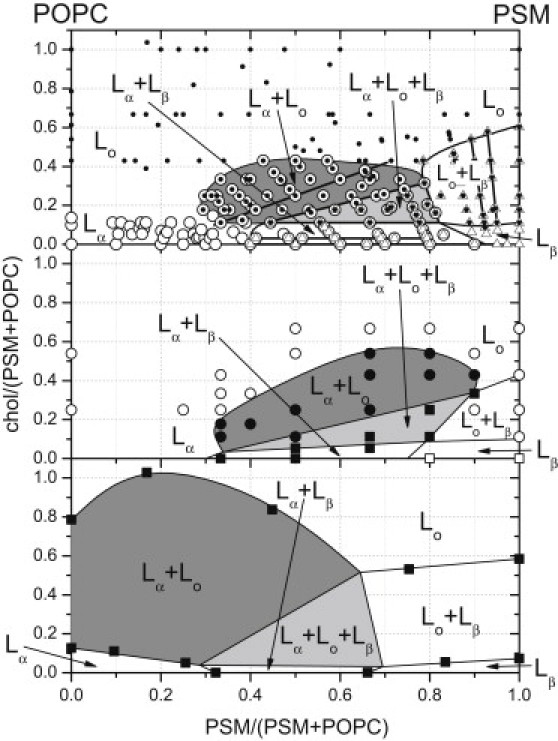
For canonical lipid raft mixtures of cholesterol (chol), N-palmitoylsphingomyelin (PSM), and 1-palmitoyl-2-oleoylphosphatidylcholine (POPC), electron paramagnetic resonance (EPR) of spin-labeled phospholipids--which is insensitive to domain size--is used to determine the ternary phase diagram at 23°C. No phase boundaries are found for binary POPC/chol mixtures, nor for ternary mixtures with PSM content <24 mol %. EPR lineshapes indicate that conversion from the liquid-disordered (L(α)) to liquid-ordered (L(o)) phase occurs continuously in this region. Two-component EPR spectra and several tie lines attributable to coexistence of gel (L(β)) and fluid phases are found for ternary mixtures with low cholesterol or low POPC content. For PSM/POPC alone, coexistence of L(α) and L(β) phases occurs over the range 50-95.5 mol % PSM. A further tie line is found at 3 mol % chol with endpoints at 50 and ≥77 mol % PSM. For PSM/chol, L(β)-L(o) coexistence occurs over the range 10-38 mol % chol and further tie lines are found at 4.5 and 7 mol % POPC. Two-component EPR spectra indicative of fluid-fluid (L(α)-L(o)) phase separation are found for lipid compositions: 25%<PSM<65%, 5%<chol<30-35%, 65%>POPC>10%, and confirmed by nonlinear EPR. Tie lines are identified in the L(α)-L(o) coexistence region, indicating that the fluid domains are of sufficient size to obey the phase rule. The three-phase triangle is bounded approximately by the compositions 40 and 75 mol % PSM with 10 mol % chol, and 60 mol % PSM with 25 mol % chol. These studies define the compositions of raft-like L(o) phases for a minimal realistic biological lipid mixture.
Copyright © 2012 Biophysical Society. Published by Elsevier Inc. All rights reserved.
Figures
 ,
,  ,
,  ,
,  ,
,  ,
,  , and
, and  refer to Lα, Lo, Lβ, Lα+Lo, Lα+Lβ, Lo+Lβ, and Lα+Lo+Lβ phases, respectively. The star indicates the approximate location of a putative critical point. Heavy straight lines within the Lα+Lβ, Lo+Lβ, and Lα+Lo coexistence regions are tie lines. The three sides of the three-phase triangle are simultaneously tie lines in the neighboring two-phase regions.
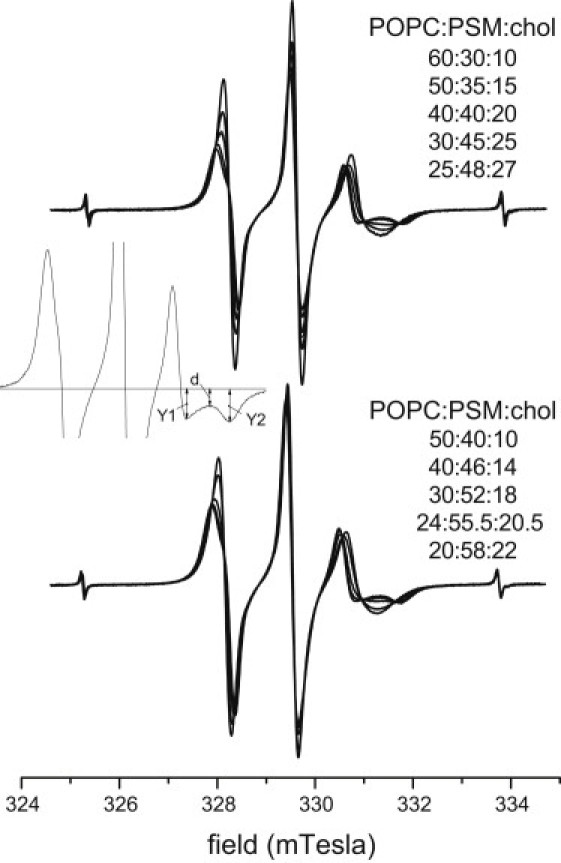
Similar articles
-
Characterization of the ternary mixture of sphingomyelin, POPC, and cholesterol: support for an inhomogeneous lipid distribution at high temperatures.Biophys J. 2008 Apr 1;94(7):2680-90. doi: 10.1529/biophysj.107.112904. Epub 2008 Jan 4. Biophys J. 2008. PMID: 18178660 Free PMC article.
-
Sphingomyelin/phosphatidylcholine/cholesterol phase diagram: boundaries and composition of lipid rafts.Biophys J. 2003 Oct;85(4):2406-16. doi: 10.1016/S0006-3495(03)74664-5. Biophys J. 2003. PMID: 14507704 Free PMC article.
-
Raftlike mixtures of sphingomyelin and cholesterol investigated by solid-state 2H NMR spectroscopy.J Am Chem Soc. 2008 Nov 5;130(44):14521-32. doi: 10.1021/ja801789t. Epub 2008 Oct 8. J Am Chem Soc. 2008. PMID: 18839945 Free PMC article.
-
Phase diagrams of lipid mixtures relevant to the study of membrane rafts.Biochim Biophys Acta. 2008 Nov-Dec;1781(11-12):665-84. doi: 10.1016/j.bbalip.2008.09.002. Epub 2008 Oct 7. Biochim Biophys Acta. 2008. PMID: 18952002 Free PMC article. Review.
-
Two phase coexistence in ternary mixtures of saturated and polyunsaturated phosphatidylcholines with cholesterol.Biochim Biophys Acta Biomembr. 2025 Oct;1867(7):184436. doi: 10.1016/j.bbamem.2025.184436. Epub 2025 Aug 6. Biochim Biophys Acta Biomembr. 2025. PMID: 40774473 Review.
Cited by
-
Normal vibrations of ternary DOPC/DPPC/cholesterol lipid bilayers by low-frequency Raman spectroscopy.RSC Adv. 2019 Oct 25;9(59):34451-34456. doi: 10.1039/c9ra06114b. eCollection 2019 Oct 23. RSC Adv. 2019. PMID: 35530012 Free PMC article.
-
Principles and Applications of Biological Membrane Organization.Annu Rev Biophys. 2020 May 6;49:19-39. doi: 10.1146/annurev-biophys-121219-081637. Epub 2020 Jan 8. Annu Rev Biophys. 2020. PMID: 31913664 Free PMC article. Review.
-
Phase diagram and tie-line determination for the ternary mixture DOPC/eSM/cholesterol.Biophys J. 2013 Apr 2;104(7):1456-64. doi: 10.1016/j.bpj.2013.02.024. Biophys J. 2013. PMID: 23561522 Free PMC article.
-
Sphingomyelin Acyl Chains Influence the Formation of Sphingomyelin- and Cholesterol-Enriched Domains.Biophys J. 2020 Sep 1;119(5):913-923. doi: 10.1016/j.bpj.2020.07.014. Epub 2020 Jul 24. Biophys J. 2020. PMID: 32755561 Free PMC article.
-
Direct imaging of liquid domains in membranes by cryo-electron tomography.Proc Natl Acad Sci U S A. 2020 Aug 18;117(33):19713-19719. doi: 10.1073/pnas.2002245117. Epub 2020 Aug 5. Proc Natl Acad Sci U S A. 2020. PMID: 32759217 Free PMC article.
References
-
- Simons K., Ikonen E. Functional rafts in cell membranes. Nature. 1997;387:569–572. - PubMed
-
- Simons K., Vaz W.L. Model systems, lipid rafts, and cell membranes. Annu. Rev. Biophys. Biomol. Struct. 2004;33:269–295. - PubMed
-
- Lingwood D., Simons K. Lipid rafts as a membrane-organizing principle. Science. 2010;327:46–50. - PubMed
-
- Vist M.R., Davis J.H. Phase equilibria of cholesterol/dipalmitoylphosphatidylcholine mixtures: 2H nuclear magnetic resonance and differential scanning calorimetry. Biochemistry. 1990;29:451–464. - PubMed
-
- Ipsen J.H., Karlström G., Zuckermann M.J. Phase equilibria in the phosphatidylcholine-cholesterol system. Biochim. Biophys. Acta. 1987;905:162–172. - PubMed
Publication types
MeSH terms
Substances
LinkOut - more resources
Full Text Sources
Medical
Miscellaneous
