Comparative Study
. 2012 Apr 18;102(8):1916-25.
doi: 10.1016/j.bpj.2012.01.047.

A comparison of genotype-phenotype maps for RNA and proteins

Affiliations
Comparative Study

A comparison of genotype-phenotype maps for RNA and proteins

Evandro Ferrada et al. Biophys J. .

Abstract

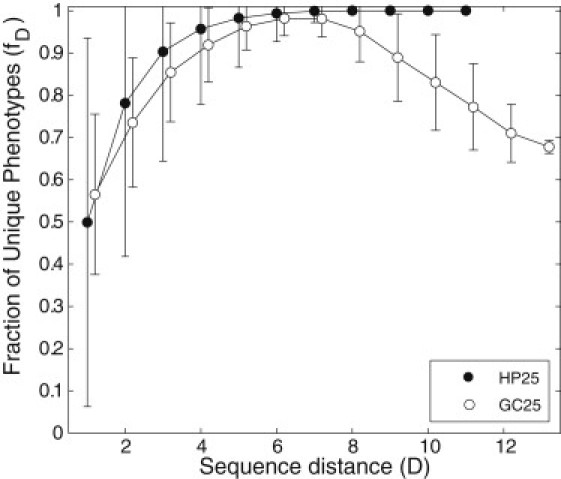
The relationship between the genotype (sequence) and the phenotype (structure) of macromolecules affects their ability to evolve new structures and functions. We here compare the genotype space organization of proteins and RNA molecules to identify differences that may affect this ability. To this end, we computationally study the genotype-phenotype relationship for short RNA and lattice proteins of a reduced monomer alphabet size, to make exhaustive analysis and direct comparison of their genotype spaces feasible. We find that many fewer protein molecules than RNA molecules fold, but they fold into many more structures than RNA. In consequence, protein phenotypes have smaller genotype networks whose member genotypes tend to be more similar than for RNA phenotypes. Neighborhoods in sequence space of a given radius around an RNA molecule contain more novel structures than for protein molecules. We compare this property to evidence from natural RNA and protein molecules, and conclude that RNA genotype space may be more conducive to the evolution of new structure phenotypes.


Figures

Figure 1
Figure 1
There are many fewer sequences per structure in proteins than in RNA. The figure shows the distribution of the number of structures (vertical axis) that are formed by a given number of sequences (horizontal axis) for protein (HP25) and RNA (GC25) data set. Note the double-logarithmic scale. Data were obtained from exhaustive enumeration of RNA sequences composed of GC nucleotides and HP protein sequences. Statistics on the number of sequences and structures are presented in Table 1.
Figure 2
Figure 2
Distribution of the mean and maximum distances of sequences in a genotype set. (Plots at the left) Distribution of the mean sequence distances (in number of monomer changes) observed per genotype set in the (A) HP25 and (C) GC25 data. (Plots at the right) Distributions of the maximum sequence distance between sequences in the same genotype set, for the (B) HP25 and (D) GC25 data sets.
Figure 3
Figure 3
Shape space covering of short RNA and protein sequences with a binary alphabet. (A) Shape space covering in neighborhoods of 103 sequences sampled at random from genotype space, regardless of the size of the genotype network to which they belong. To estimate shape space covering of a particular sequence we determined the percentage of all structures that can be observed within a ball of a given radius (horizontal axis) around the sequence. (B) Shape space covering of the most populated genotype networks. We estimated the shape space covering of an entire network by counting the number of different phenotypes contained within a neighborhood of a given radius around random samples of sequences in the networks. The data shown are based on all genotype networks in the top 0.1 percentile of genotype network size. This percentile corresponds to 2260 and 148 RNA and protein genotype networks, respectively. A total of 103 randomly sampled sequences were obtained from RNA networks and because protein networks are considerably smaller than RNA networks, they were explored exhaustively. Error bars correspond to 1 SD.
Figure 4
Figure 4
Novel structures in the neighborhood of different genotypes on the same genotype network. (Horizontal axis) Genotype distance D between two genotypes on the same protein (HP25) or RNA (GC25) genotype network. (Vertical axis) Fraction of new phenotypes (fD) that is unique to one neighborhood, in the sense that it occurs in the neighborhood of one of these genotypes but not the other. Data are based on genotype networks in the top 0.1 percentile of genotype network size. Sampling was carried out as described above (see Fig. 3B legend and main text for details). Error bars correspond to 1 SD.
Figure 5
Figure 5
Comparison of sequence-structure relationships for natural proteins and RNA molecules. (A) Sequence identity versus tertiary structure identity for proteins. The figure shows sequence identity calculated over the structurally aligned residues (horizontal axis) versus structural identity (vertical axis). The figure is based on pairwise comparisons of 1883 single-chain proteins from the Protein Data Bank (24) that were solved by x-ray crystallography and that fulfilled the following criteria: The structure's resolution is at least 3.0 Å, the protein has no bound ligands, and it is a size that lies between 100 and 200 amino acids. Structural alignments were produced with the software MAMMOTH (25) from a random sample of 2760 protein pairs (see Methods). Data points shown in panel A were filtered at a logarithmically (base e) transformed p-value exceeding 5.0. (B) Sequence identity versus tertiary structure identity for RNA. The figure shows sequence identity over all structurally aligned residues (horizontal axis) versus percentage of structural identity (vertical axis). The data are based on 1210 alignments (158 structures) extracted from a larger data set of 451 structures with 101,475 alignments produced with the program SARA (28).

References

    1. Wilson D.S., Szostak J.W. In vitro selection of functional nucleic acids. Annu. Rev. Biochem. 1999;68:611–647. - PubMed
    1. Smith J.M. Natural selection and the concept of a protein space. Nature. 1970;225:563–564. - PubMed
    1. Lau K.F., Dill K.A. A lattice statistical mechanics model of the conformational and sequence spaces of proteins. Macromolecules. 1989;22:3986–3997.
    1. Bornberg-Bauer E. How are model protein structures distributed in sequence space? Biophys. J. 1997;73:2393–2403. - PMC - PubMed
    1. Buchler N.E.G., Goldstein R.A. Effect of alphabet size and foldability requirements on protein structure designability. Proteins. 1999;34:113–124. - PubMed

Publication types

LinkOut - more resources