. 2012 Jul 8:8:50.
doi: 10.1186/1744-8069-8-50.

Dose-dependent expression of neuronal injury markers during experimental osteoarthritis induced by monoiodoacetate in the rat

Affiliations

Dose-dependent expression of neuronal injury markers during experimental osteoarthritis induced by monoiodoacetate in the rat

Joana Ferreira-Gomes et al. Mol Pain. .

Abstract

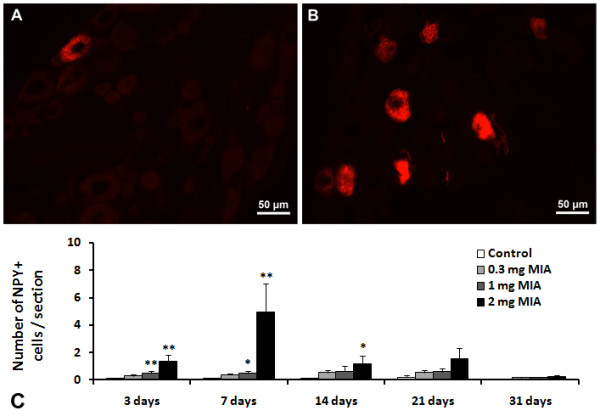
Background: It was recently reported that the mono-iodoacetate (MIA) experimental model of osteoarthritis (OA) courses with changes of neurons innervating the affected joints that are commonly interpreted as a neuronal response to axonal injury. To better characterize these changes, we evaluated the expression of two markers of neuronal damage, ATF-3 and NPY, and the growth associated protein GAP-43, in primary afferent neurons of OA animals injected with three different doses of MIA (0.3, 1 or 2 mg). Measurements were performed at days 3, 7, 14, 21 and 31 post-MIA injection.

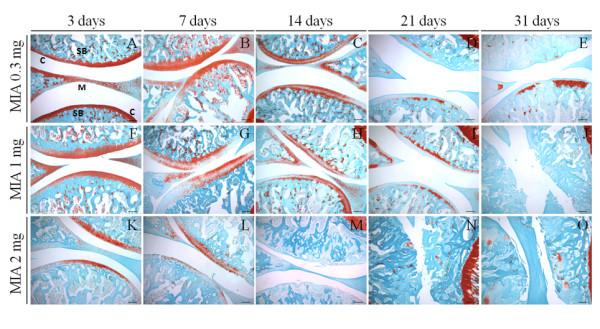
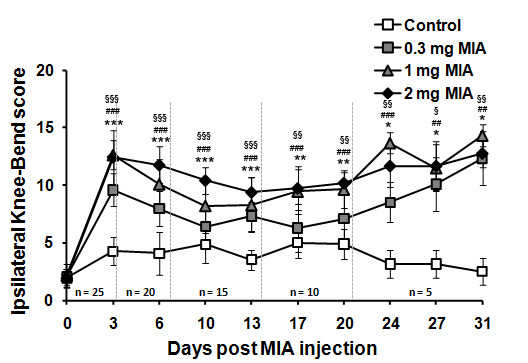
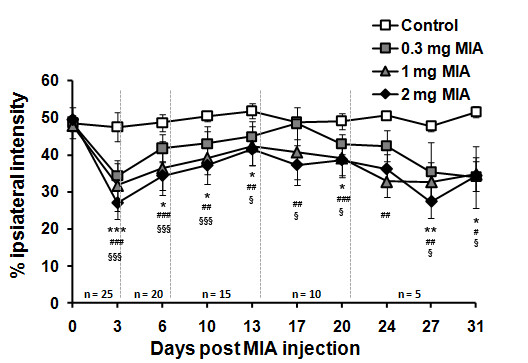
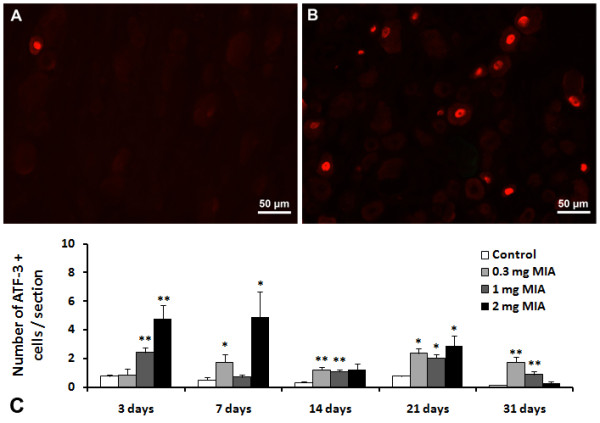
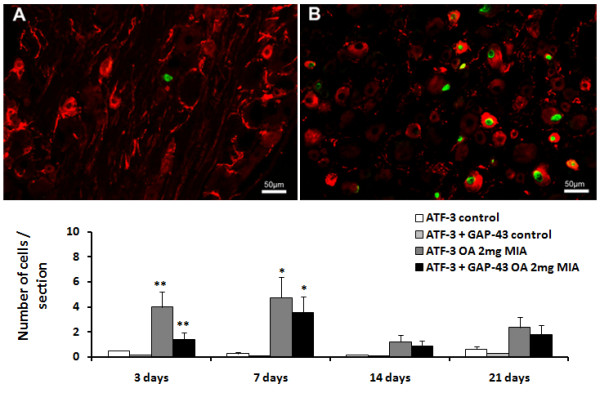
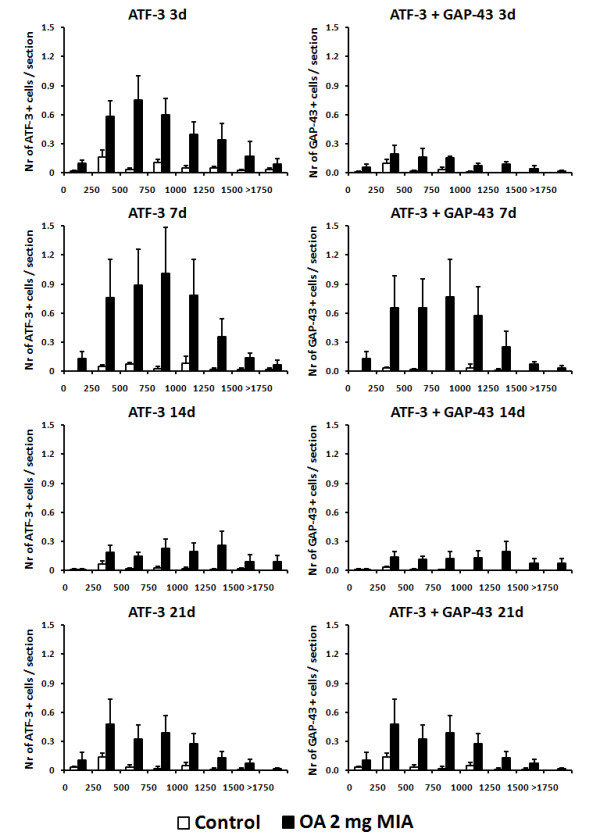
Results: OA animals showed the characteristic histopathological changes of the joints and the accompanying nociceptive behaviour, evaluated by the Knee-Bed and CatWalk tests. An increase of ATF-3 expression was detected in the DRG of OA animals as early as 3 days after the injection of 1 or 2 mg of MIA and 7 days after the injection of 0.3 mg. NPY expression was increased in animals injected with 1 or 2 mg of MIA, at day 3 or in all time-points, respectively. From day 7 onwards there was a massive increase of GAP-43 expression in ATF-3 cells.

Conclusions: The expression of the neuronal injury markers ATF-3 and NPY as well as an up-regulation of GAP-43 expression, indicative of peripheral fibre regeneration, suggests that axonal injury and a regeneration response may be happening in this model of OA. This opens new perspectives in the unravelling of the physiopathology of the human disease.


Figures

Figure 1
Figure 1
Histopathology of knee sections of OA animals. Rats received an intra-articular injection of 0.3 (A-E), 1 (F-J) or 2 mg (K-O) of MIA and were sacrificed at 3 (A, F, K), 7 (B, G, L), 14 (C, H, M), 21 (D, I, N) and 31 days (E, J, O) post-MIA injection. Each rat knee image is representative of a group of 5 animals. The sections were stained with Safranin-O that stained cartilage and its proteoglycan content and Fast Green, which stains bone. Histopathological alterations, namely decrease in proteoglycan staining, chondrocyte death, loss of intercellular matrix, decrease of the thickness of the articular cartilage, erosion of the hyaline articular cartilage and exposure of the subcondral bone, were dose and time-dependent. C indicates cartilage; SB, subchondral bone; M, meniscus. Scale bar: 200 μm.
Figure 2
Figure 2
Evolution of the Knee-Bend score of animals injected with saline (control; n = 5) or 0.3, 1 or 2 mg of MIA (OA; n = 25/group) on various days after the injection until the day of sacrifice (3, 7, 14, 21, 31). At each sacrifice time-point 5 animals per group were euthanized. Baseline score was determined for all animals prior to the injection (day 0). * P < 0.05, ** P < 0.01, *** P < 0.001 significantly different from baseline values for the 0.3 mg dose of MIA; ## P < 0.01, ### P < 0.001 significantly different from baseline values for the 1 mg dose of MIA; § P < 0.05, §§ P < 0.01, §§§ P < 0.001 significantly different from baseline values for the 2 mg dose of MIA (Repeated Measures ANOVA followed by LSD post-hoc test).
Figure 3
Figure 3
Evolution of the percentage of the ipsilateral paw-print total intensity, assessed in the CatWalk test, of animals injected with saline (control; n = 5) or 0.3, 1 or 2 mg of MIA (OA; n = 25/group) on various days after the injection until the day of sacrifice (3, 7, 14, 21, 31). At each sacrifice time-point, 5 animals per group were euthanized. Baseline score was determined for all animals prior to injection (day 0). * P < 0.05, *** P < 0.001 significantly different from baseline values for the 0.3 mg dose of MIA; # P < 0.05, ## P < 0.01, ### P < 0.001 significantly different from baseline values for the 1 mg dose of MIA; § P < 0.05, §§§ P < 0.001 significantly different from baseline values for the 2 mg dose of MIA (Repeated Measures ANOVA followed by LSD post-hoc test).
Figure 4
Figure 4
ATF-3 expression in L3, L4 and L5 ipsilateral DRG. Animals received an intra-articular injection of saline (control) or 0.3, 1 or 2 mg of MIA (OA) and were sacrificed at 3, 7, 14, 21 and 31 days post-injection. A and B are images representative of immunofluorescence reactions for ATF-3 from control rats (A) and rats injected with 2 mg of MIA (B) sacrificed at 7 days. * P < 0.05, ** P < 0.01 significantly different from controls (Mann–Whitney test).
Figure 5
Figure 5
NPY expression in L3, L4 and L5 ipsilateral DRG. Animals received an intra-articular injection of saline (control) or 0.3, 1 or 2 mg of MIA (OA) and were sacrificed at 3, 7, 14, 21 and 31 days post-injection. A and B are images representative of immunofluorescence reactions for NPY from control rats (A) and rats injected with 2 mg of MIA (B) sacrificed at 7 days. * P < 0.05, ** P < 0.01 significantly different from controls (Mann–Whitney test).
Figure 6
Figure 6
GAP-43 expression in ATF-3 positive cells in L3, L4 and L5 ipsilateral DRG. Animals received an intra-articular injection of saline (control) or 2 mg of MIA (OA) and were sacrificed at 3, 7, 14 and 21 days post-injection. A and B are images representative of immunofluorescence reactions for ATF-3 plus GAP-43 in sections of ipsilateral DRG from control rats (A) and rats injected with 2 mg of MIA (B) sacrificed at 7 days.
Figure 7
Figure 7
ATF-3 and GAP-43 plus ATF-3 expression per neuronal perikaria cross-sectional area range of control and 2 mg of MIA OA animals. The DRGs were evaluated at 3, 7, 14 and 21 days post-injection.

References

    1. Hart FD. Pain in osteoarthrosis. Practitioner. 1974;212:244–250. - PubMed
    1. Just S, Pawlak M, Heppelmann B. Responses of fine primary afferent nerve fibres innervating the rat knee joint to defined torque. J Neurosci Methods. 2000;103:157–162. doi: 10.1016/S0165-0270(00)00310-1. - DOI - PubMed
    1. Schaible HG, Schmidt RF. Responses of fine medial articular nerve afferents to passive movements of knee joints. J Neurophysiol. 1983;49:1118–1126. - PubMed
    1. Guzman RE, Evans MG, Bove S, Morenko B, Kilgore K. Mono-iodoacetate-induced histologic changes in subchondral bone and articular cartilage of rat femorotibial joints: an animal model of osteoarthritis. Toxicol Pathol. 2003;31:619–624. - PubMed
    1. Kalbhen DA. Chemical model of osteoarthritis – a pharmacological evaluation. J Rheumatol. 1987;14:130–131. - PubMed

Publication types

MeSH terms

LinkOut - more resources