. 2012 Jul 6;150(1):53-64.
doi: 10.1016/j.cell.2012.05.029.

U1 snRNP determines mRNA length and regulates isoform expression

Affiliations

U1 snRNP determines mRNA length and regulates isoform expression

Michael G Berg et al. Cell. .

Abstract

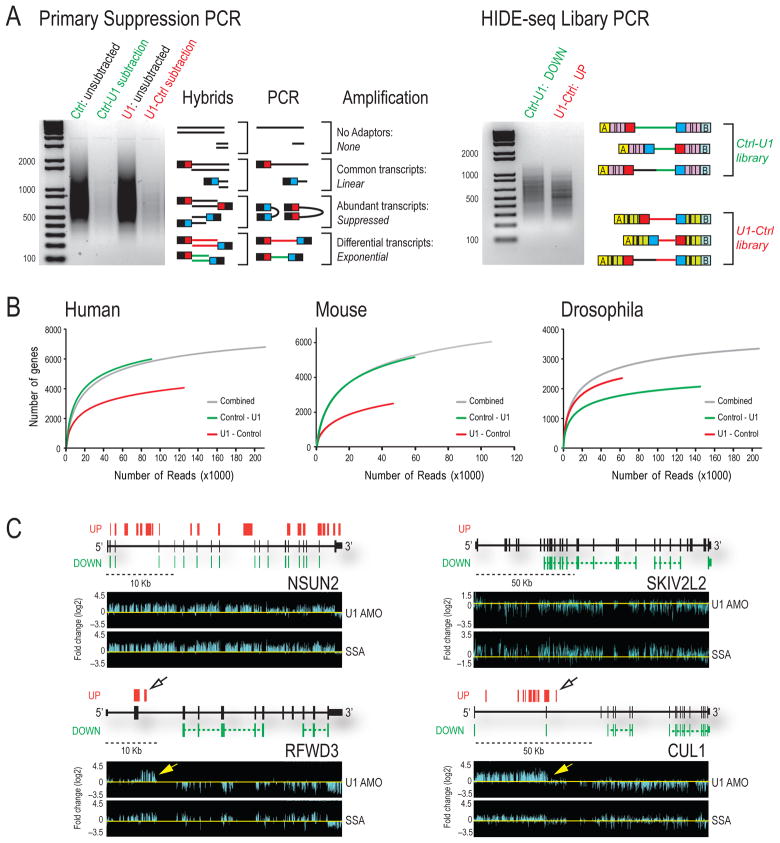
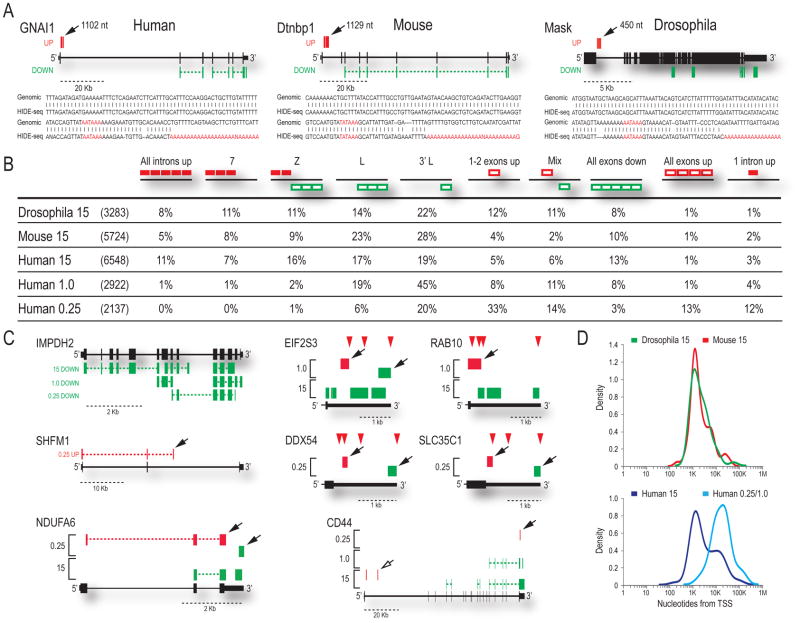
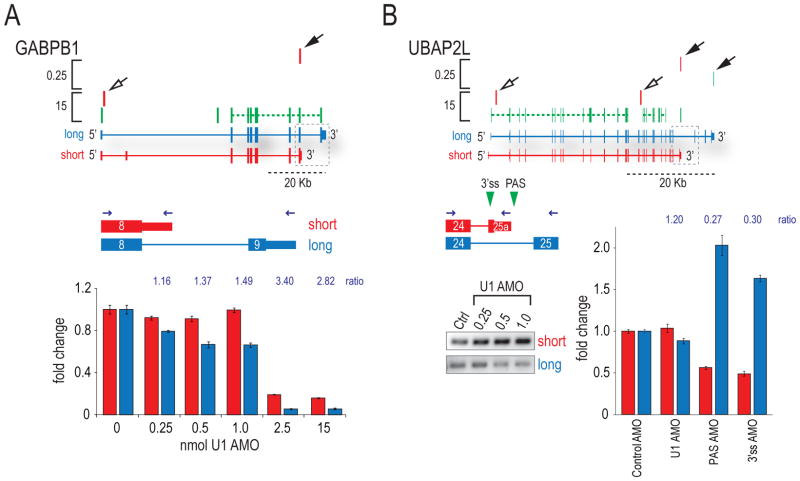
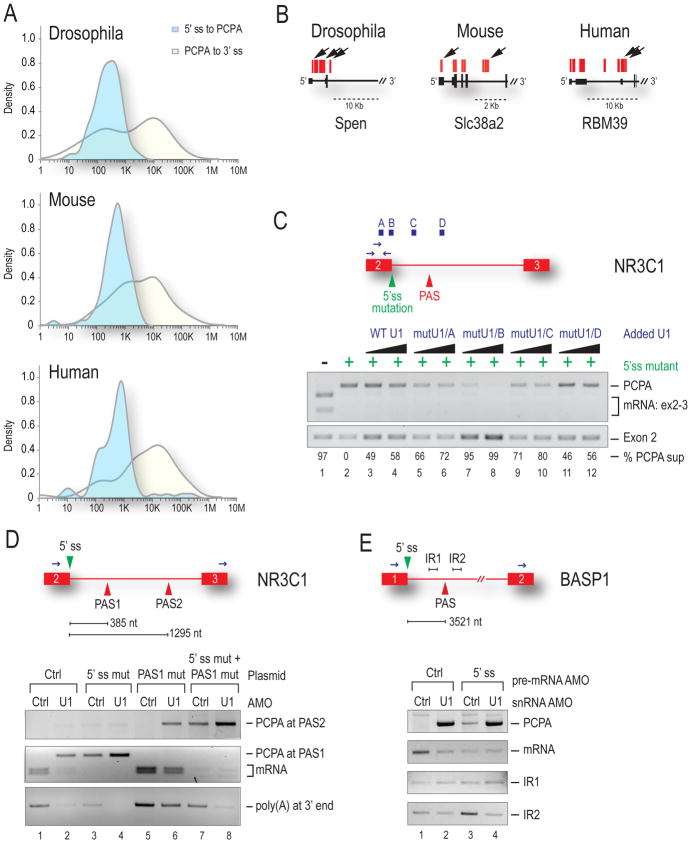
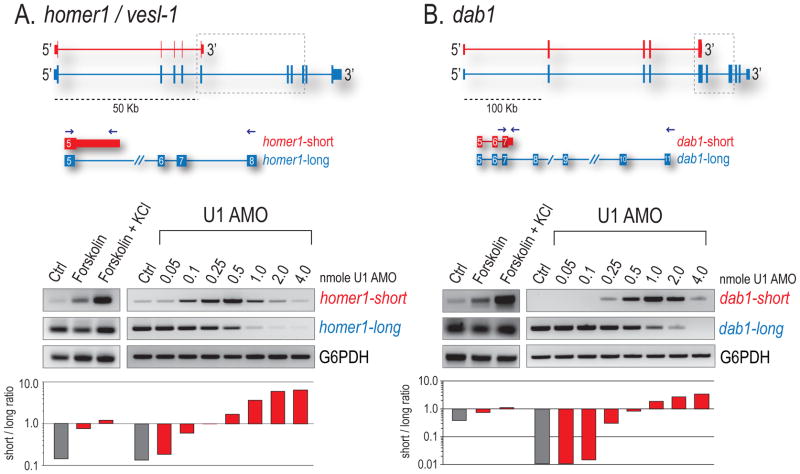
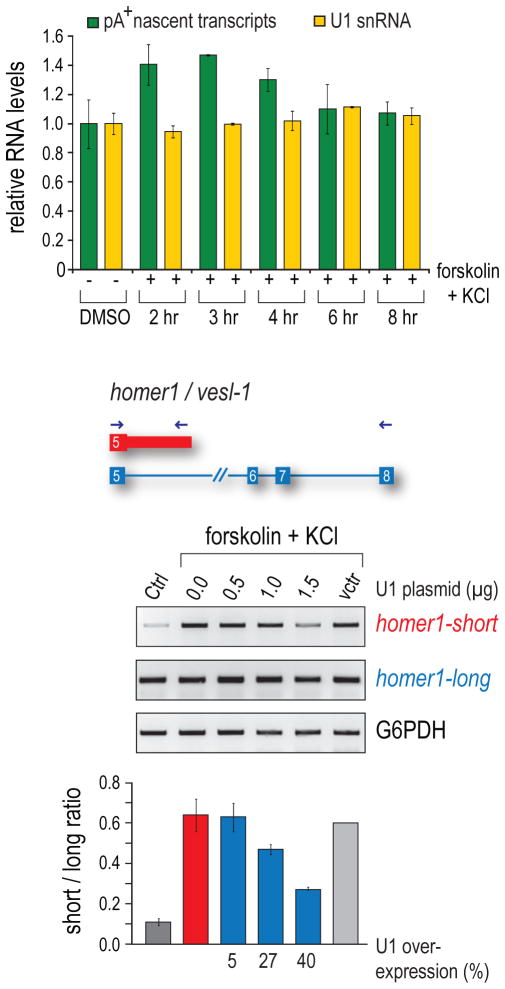
U1 snRNP (U1), in addition to its splicing role, protects pre-mRNAs from drastic premature termination by cleavage and polyadenylation (PCPA) at cryptic polyadenylation signals (PASs) in introns. Here, a high-throughput sequencing strategy of differentially expressed transcripts (HIDE-seq) mapped PCPA sites genome wide in divergent organisms. Surprisingly, whereas U1 depletion terminated most nascent gene transcripts within ~1 kb, moderate functional U1 level decreases, insufficient to inhibit splicing, dose-dependently shifted PCPA downstream and elicited mRNA 3' UTR shortening and proximal 3' exon switching characteristic of activated immune and neuronal cells, stem cells, and cancer. Activated neurons' signature mRNA shortening could be recapitulated by U1 decrease and antagonized by U1 overexpression. Importantly, we show that rapid and transient transcriptional upregulation inherent to neuronal activation physiology creates U1 shortage relative to pre-mRNAs. Additional experiments suggest cotranscriptional PCPA counteracted by U1 association with nascent transcripts, a process we term telescripting, ensuring transcriptome integrity and regulating mRNA length.


Figures

Figure 1
Figure 1. HIDE-seq identifies genome-wide transcriptome changes
(A) Unsubtracted and subtracted libraries prepared in both directions (Control-U1, green; U1-Control, red) are shown (left gel) along with possible products of suppression PCR. Differentially expressed sequences are in red or green and common sequences in black. Nested PCR (right gel) was performed with primers containing barcodes (hashed lines) and 454 adaptors A and B (yellow and light blue). (B) Randomly sampled reads with greater than 90% coverage and 90% identity were plotted against affected genes for HeLa, NIH/3T3 and S2 from individual or combined (grey) subtractions. (C) HIDE-seq reads are above [U1-Control (UP)] and below [Control-U1 (DOWN)] gene structures in black (block = exon, thin block = UTR, horizontal line = intron). Spliced reads are connected by colored dashed lines whereas immediately adjacent reads separated by RsaI, HaeIII, and AluI sites are not. Log2 fold changes from GTA of U1 AMO or SSA-treated HeLa cells normalized to controls (bottom panels). Yellow and open arrows point to inferred PCPA sites. See also Table S1 and Supplemental Figure S1.
Figure 2
Figure 2. Transcriptome profiles show a conserved function of U1 snRNP in PCPA suppression
(A) HIDE-seq profiles are shown along with sequences of poly(A) reads (location indicated by solid arrows) aligned to the genome for S2, NIH/3T3, and HeLa. Distance (nt) is relative to the upstream 5’ss with the PAS hexamer likely used and stretches of A’s added to HIDE-seq reads in red. See also Supplemental Figures S2–S4. (B) Illustrations of patterns observed (depicted above each column; e.g. Z: red up then green down) after U1 AMO with the percentage of each category reported for Drosophila (15), mouse (15) and human at three doses (15, 1.0, 0.25) compared to the total number of affected genes in parenthesis. Introns = solid red boxes; exons = empty boxes. (C) Individual examples of patterns described in Figure 2B are shown with brackets indicating results from more than one concentration. Solid arrows indicate reads ending in poly(A) tails; open arrows are inferred PCPA; red triangles are documented PASs. (D) Using reads with poly(A) tails terminating in introns (Figures S2–S5), the distribution of distances of PCPA relative to the TSS are plotted for Drosophila and mouse (top), and human at high and low U1 AMO (bottom).
Figure 3
Figure 3. Moderate U1 reduction-induced PCPA regulates expression of short isoforms
(A) HIDE-seq profile for GABPB1 at high and low U1 AMO are above diagrams of long (blue) and short (red) isoforms. RT-qPCR of short and long isoforms was performed on cDNA from cells transfected with a range of U1 AMO concentrations using a common forward and different reverse primers as indicated (blue arrows). Grey dotted boxes indicate region of transcript probed. Ratios of short to long are reported above histograms. (B) UBAP2L was probed by RT-PCR for short (due to 3′ exon switching) and long isoforms (gels) and by RT-qPCR on cDNA from cells treated with various AMOs. Green triangle = 3’ss and PAS AMOs, black arrows = poly(A) reads; open arrows = inferred PCPA.
Figure 4
Figure 4. U1 bound outside the 5’ss is required to suppress PASs >1kb away
(A) Distribution of the log10 distance at which PCPA occurred was measured in each organism from the start of the poly(A) tail back to the upstream 5’ss (light blue) or downstream to the 3’ss (yellow). See also Supplemental Figures S2–S4 and Table S2. (B) Arrows indicate multiple PCPA sites per gene. (C) HeLa cells were transfected with WT NR3C1 mini-gene (lane 1) or one containing a 5’ss mutation (lanes 2–12) and increasing amounts of mutant U1 that base-pairs to one of four locations along the pre-mRNA (above in blue). PCPA in the intron was detected by 3′RACE with RT-PCR of exon 2 serving as the loading control. Percent suppression (PCPA to exon 2 ratio) was normalized to lane 2. (D) Control or U1 AMO were transfected along with WT NR3C1 mini-gene (lanes 1 & 2) or NR3C1 in which the PAS1 [385 nt] sequence in the intron was duplicated (PAS2) and placed 1295 nt downstream of the 5’ss. Mini-genes in which the 5’ss (lanes 3 & 4), PAS1 (lanes 5 & 6) or both (lanes 7 & 8) were mutated are indicated. 3′RACE was performed as in (C). (E) Control, U1 or an AMO to the 5’ss of the endogenous BASP1 gene were transfected as indicated. PCPA at the PAS 3.5 kb downstream of exon 1 was measured by 3′ RACE. RT-PCR on intronic sequences upstream (IR1) and downstream (IR2) of the PAS is shown.
Figure 5
Figure 5. Moderate U1 reduction recapitulates isoform switching upon neuronal activation
Rat PC12 (A) and mouse MN-1 (B) neurons were stimulated with forskolin or forskolin/KCl for 3 hrs or separately transfected with control AMO or increasing amounts of U1 AMO. RT-PCR detecting short and long forms of Homer-1/Vesl-1 and Dab-1 are shown with histograms depicting the ratio of S/L. Grey dotted boxes indicate the region of transcript probed, blue arrows show primer locations, and G6PDH is a loading control.
Figure 6
Figure 6. U1 ratio to pre-mRNA determines immediate-early polyadenylation switch
(A) PC12 were activated with forskolin/KCl or mock treated (DMSO) for the indicated times and labeled with 3H-uridine for 30 min prior to collection. Ratios of nascent transcripts (green) to total RNA were determined by scintillation and normalized to amounts of unlabeled total RNA. DMSO controls represent the average of 6 time points per experiment and activated values represent the average of two independent experiments (3 hr time point measured once). U1 snRNA (yellow) was measured by RT-qPCR at the same time points. (B) PC12 cells were transfected overnight (24 hrs) to over-express U1 (or empty vector) and activated with forskolin/KCl. Homer-1 isoforms were probed by RT-PCR 3 hrs after activation, as in Figure 5A. Histograms depict the ratio of S/L forms from biological repeat experiments with percent U1 over-expression reported below.
Figure 7
Figure 7. A proposed model of co-transcriptional PCPA and its suppression by U1
Cleavage and polyadenylation factors (CPSF) associate with pol II TEC and is thus poised for 3′-end cleavage and polyadenylation, but can also cause premature termination (PCPA) from cryptic PASs found throughout pre-mRNAs. U1 is recruited to nascent transcripts by multiple interactions, including base pairing of its 5′-end with cognate pre-mRNA sequences (5’ ss and other) and can suppress PCPA by inhibiting the pol II associated CPSF over < 1kb range. U1 shortage increases the probability of distal PASs remaining unprotected.

Comment in

  • U1 snRNA rewrites the "script".
    Merkhofer EC, Johnson TL. Merkhofer EC, et al. Cell. 2012 Jul 6;150(1):9-11. doi: 10.1016/j.cell.2012.06.017. Cell. 2012. PMID: 22770211 Free PMC article.

References

    1. Ashe MP, Furger A, Proudfoot NJ. Stem-loop 1 of the U1 snRNP plays a critical role in the suppression of HIV-1 polyadenylation. RNA. 2000;6:170–177. - PMC - PubMed
    1. Bartel DP. MicroRNAs: target recognition and regulatory functions. Cell. 2009;136:215–233. - PMC - PubMed
    1. Beaudoing E, Freier S, Wyatt JR, Claverie JM, Gautheret D. Patterns of variant polyadenylation signal usage in human genes. Genome Res. 2000;10:1001–1010. - PMC - PubMed
    1. Brody Y, Neufeld N, Bieberstein N, Causse SZ, Bohnlein EM, Neugebauer KM, Darzacq X, Shav-Tal Y. The in vivo kinetics of RNA polymerase II elongation during co-transcriptional splicing. PLoS Biol. 2011;9:e1000573. - PMC - PubMed
    1. Buratowski S. Progression through the RNA polymerase II CTD cycle. Mol Cell. 2009;36:541–546. - PMC - PubMed

Publication types

Substances

LinkOut - more resources