

Trends in mild, moderate, and severe stunting and underweight, and progress towards MDG 1 in 141 developing countries: a systematic analysis of population representative data
- PMID: 22770478
- PMCID: PMC3443900
- DOI: 10.1016/S0140-6736(12)60647-3
Trends in mild, moderate, and severe stunting and underweight, and progress towards MDG 1 in 141 developing countries: a systematic analysis of population representative data
Abstract
Background: There is little information on country trends in the complete distributions of children's anthropometric status, which are needed to assess all levels of mild to severe undernutrition. We aimed to estimate trends in the distributions of children's anthropometric status and assess progress towards the Millennium Development Goal 1 (MDG 1) target of halving the prevalence of weight-for-age Z score (WAZ) below -2 between 1990 and 2015 or reaching a prevalence of 2·3% or lower.
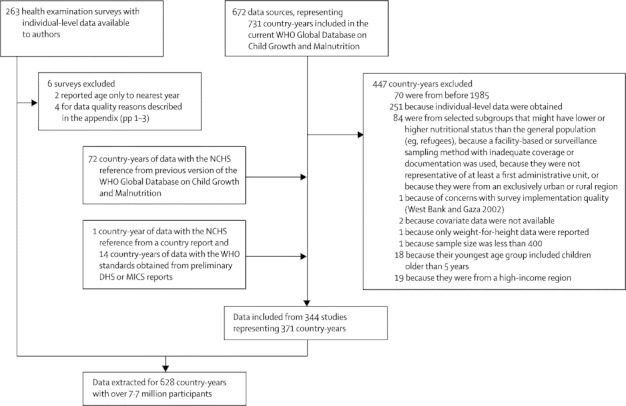
Methods: We collated population-representative data on height-for-age Z score (HAZ) and WAZ calculated with the 2006 WHO child growth standards. Our data sources were health and nutrition surveys, summary statistics from the WHO Global Database on Child Growth and Malnutrition, and summary statistics from reports of other national and international agencies. We used a Bayesian hierarchical mixture model to estimate Z-score distributions. We quantified the uncertainty of our estimates, assessed their validity, compared their performance to alternative models, and assessed sensitivity to key modelling choices.
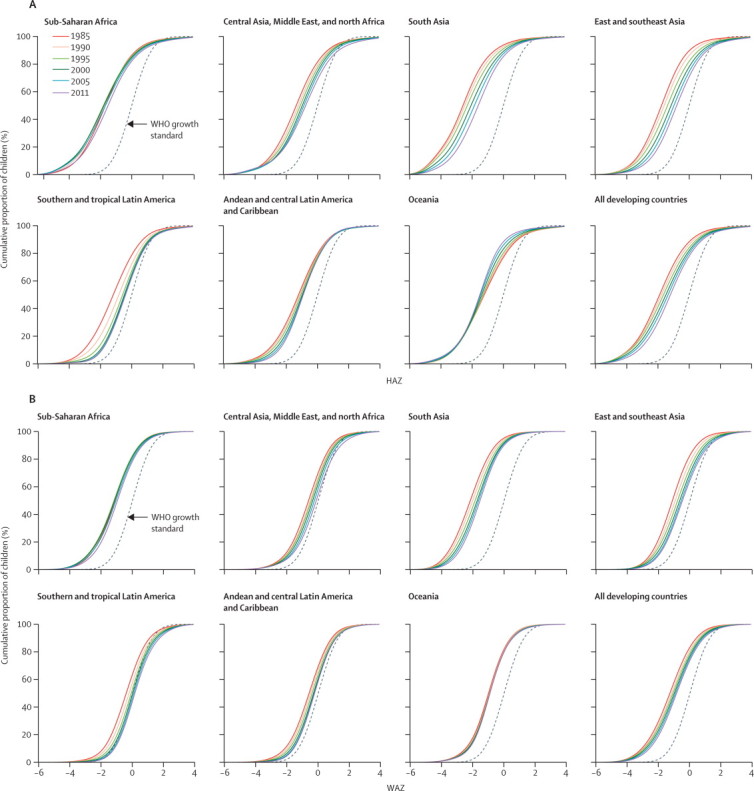
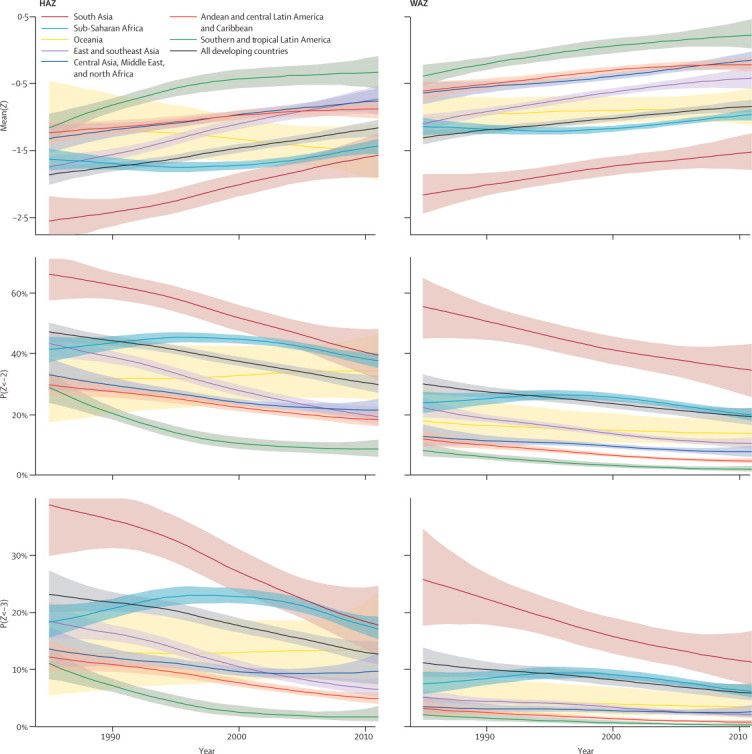
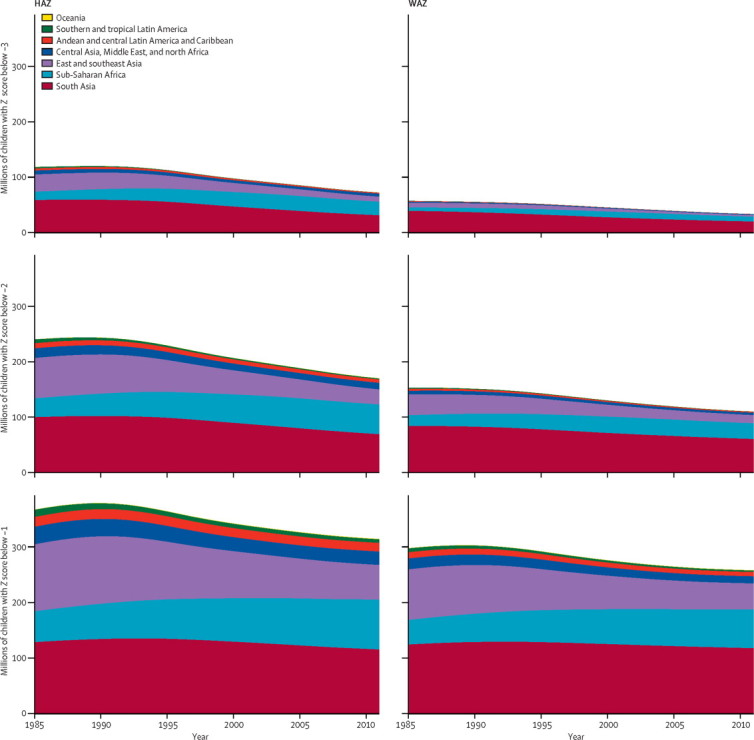
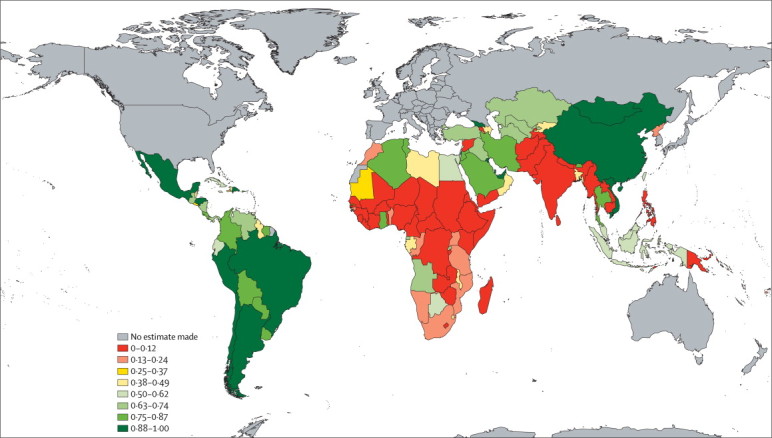
Findings: In developing countries, mean HAZ improved from -1·86 (95% uncertainty interval -2·01 to -1·72) in 1985 to -1·16 (-1·29 to -1·04) in 2011; mean WAZ improved from -1·31 (-1·41 to -1·20) to -0·84 (-0·93 to -0·74). Over this period, prevalences of moderate-and-severe stunting declined from 47·2% (44·0 to 50·3) to 29·9% (27·1 to 32·9) and underweight from 30·1% (26·7 to 33·3) to 19·4% (16·5 to 22·2). The largest absolute improvements were in Asia and the largest relative reductions in prevalence in southern and tropical Latin America. Anthropometric status worsened in sub-Saharan Africa until the late 1990s and improved thereafter. In 2011, 314 (296 to 331) million children younger than 5 years were mildly, moderately, or severely stunted and 258 (240 to 274) million were mildly, moderately, or severely underweight. Developing countries as a whole have less than a 5% chance of meeting the MDG 1 target; but 61 of these 141 countries have a 50-100% chance.
Interpretation: Macroeconomic shocks, structural adjustment, and trade policy reforms in the 1980s and 1990s might have been responsible for worsening child nutritional status in sub-Saharan Africa. Further progress in the improvement of children's growth and nutrition needs equitable economic growth and investment in pro-poor food and primary care programmes, especially relevant in the context of the global economic crisis.
Funding: The Bill & Melinda Gates Foundation and the UK Medical Research Council.
Copyright © 2012 Elsevier Ltd. All rights reserved.
Figures
Comment in
-
Challenges in ameliorating hunger while preventing obesity.Lancet. 2012 Sep 1;380(9844):787-9. doi: 10.1016/S0140-6736(12)60909-X. Epub 2012 Jul 5. Lancet. 2012. PMID: 22770477 No abstract available.
-
Demographic entrapment is preventing Africa from reaching MDG 1.Lancet. 2012 Nov 3;380(9853):1557. doi: 10.1016/S0140-6736(12)61880-7. Lancet. 2012. PMID: 23122247 No abstract available.
-
What is more important? Measuring trends in child undernutrition correctly or interpreting them adequately?Pathog Glob Health. 2012 Aug;106(4):217. doi: 10.1179/2047772412Z.00000000059. Pathog Glob Health. 2012. PMID: 23265421 Free PMC article. No abstract available.
References
-
- Scrimshaw NS, SanGiovanni JP. Synergism of nutrition, infection, and immunity: an overview. Am J Clin Nutr. 1997;66:464S–477S. - PubMed
-
- Black RE, Allen LH, Bhutta ZA. Maternal and child undernutrition: global and regional exposures and health consequences. Lancet. 2008;371:243–260. - PubMed
-
- UNICEF . Strategy for improved nutrition of children and women in developing countries. UNICEF; New York, NY: 1990.
-
- de Onis M, Blossner M, Borghi E, Frongillo EA, Morris R. Estimates of global prevalence of childhood underweight in 1990 and 2015. JAMA. 2004;291:2600–2606. - PubMed
Publication types
MeSH terms
Grants and funding
LinkOut - more resources
Full Text Sources
Medical
Molecular Biology Databases
