

Reliability of early cortical auditory gamma-band responses
- PMID: 22771035
- PMCID: PMC3468656
- DOI: 10.1016/j.clinph.2012.06.003
Reliability of early cortical auditory gamma-band responses
Abstract
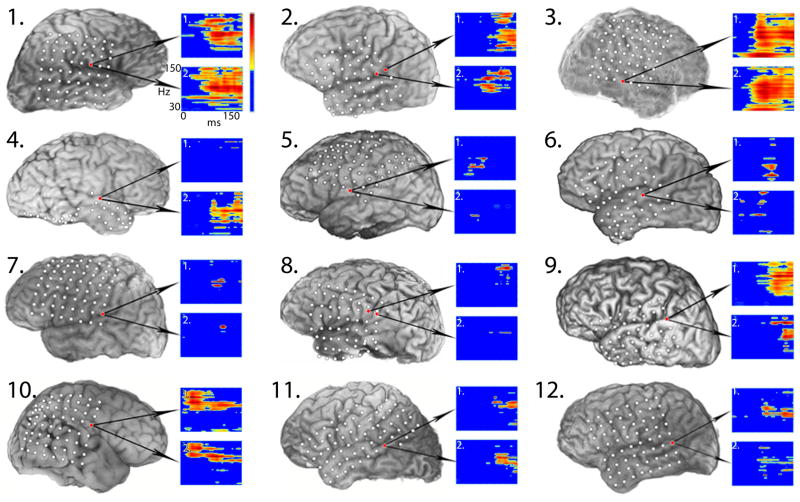
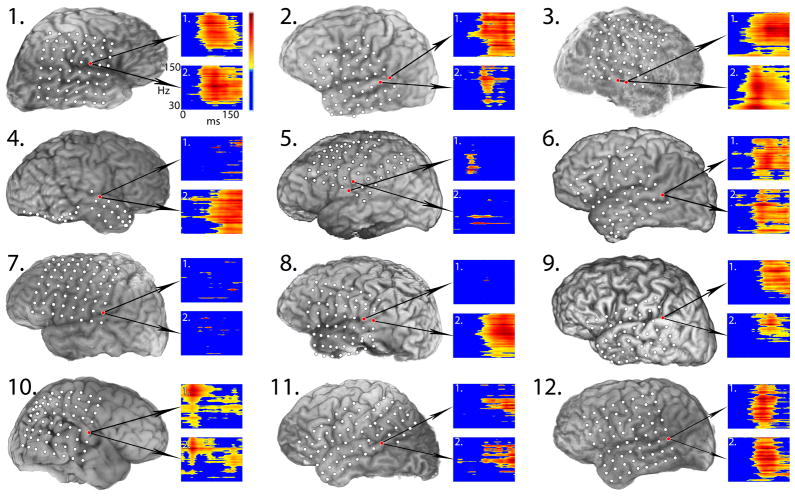
Objective: To evaluate the test-retest reliability of event-related power changes in the 30-150 Hz gamma frequency range occurring in the first 150 ms after presentation of an auditory stimulus.
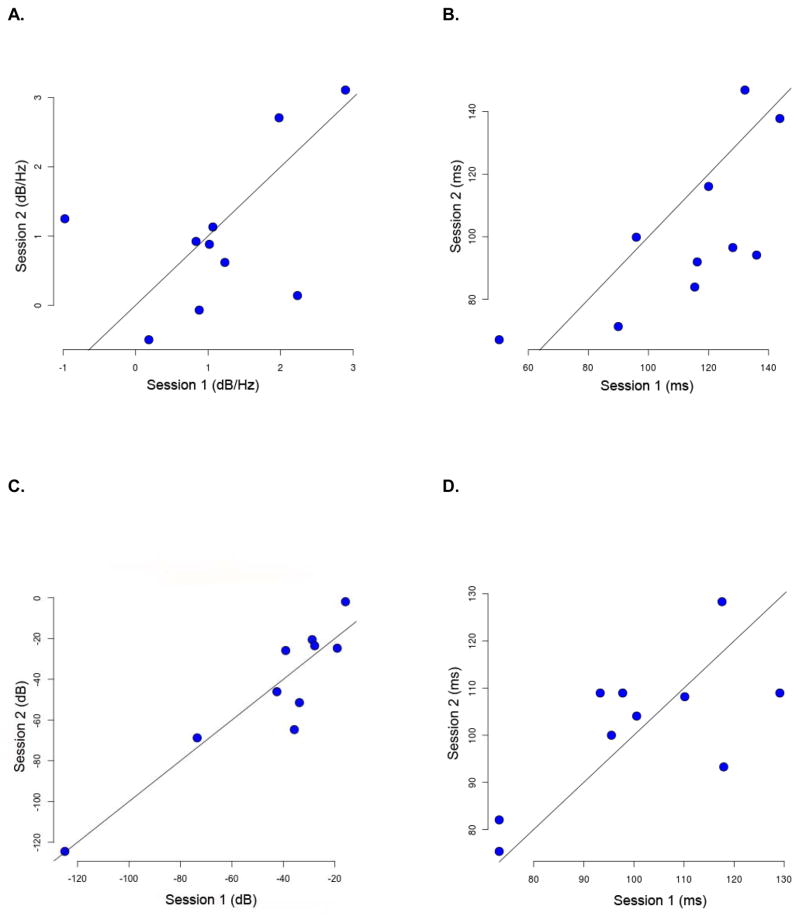
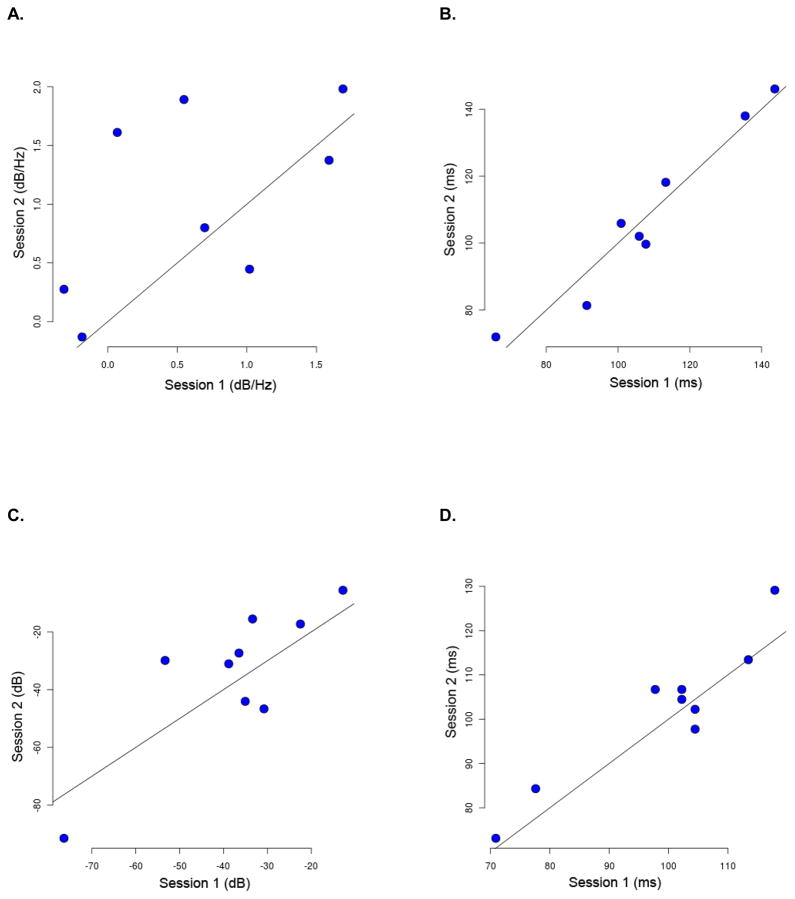
Methods: Repeat intracranial electrocorticographic (ECoG) recordings were performed with 12 epilepsy patients, at ≥1-day intervals, using a passive odd-ball paradigm with steady-state tones. Time-frequency matching pursuit analysis was used to quantify changes in gamma-band power relative to pre-stimulus baseline. Test-retest reliability was estimated based on within-subject comparisons (paired t-test, McNemar's test) and correlations (Spearman rank correlations, intra-class correlations) across sessions, adjusting for within-session variability. Reliability estimates of gamma-band response robustness, spatial concordance, and reproducibility were compared with corresponding measurements from concurrent auditory evoked N1 responses.
Results: All patients showed increases in gamma-band power, 50-120 ms post-stimulus onset, that were highly robust across recordings, comparable to the evoked N1 responses. Gamma-band responses occurred regardless of patients' performance on behavioral tests of auditory processing, medication changes, seizure focus, or duration of test-retest interval. Test-retest reproducibility was greatest for the timing of peak power changes in the high-gamma range (65-150 Hz). Reliability of low-gamma responses and evoked N1 responses improved at higher signal-to-noise levels.
Conclusions: Early cortical auditory gamma-band responses are robust, spatially concordant, and reproducible over time.
Significance: These test-retest ECoG results confirm the reliability of auditory gamma-band responses, supporting their utility as objective measures of cortical processing in clinical and research studies.
Copyright © 2012 International Federation of Clinical Neurophysiology. Published by Elsevier Ireland Ltd. All rights reserved.
Conflict of interest statement
Figures
References
-
- Ball T, Demandt E, Mutschler I, Neitzel E, Mehring C, Vogt K, et al. Movement related activity in the high gamma range of the human EEG. Neuroimage. 2008;41:302–310. - PubMed
-
- Benjamini Y, Hochberg Y. Controlling the false discovery rate: a practical and powerful approach to multiple testing. J R Stat Soc Ser B. 1995;57:289–300.
-
- Boatman DF, Lesser RP, Crone NE, Krauss G, Lenz FA, Miglioretti DL. Speech recognition impairments in patients with intractable right temporal lobe epilepsy. Epilepsia. 2006;47:1397–1401. - PubMed
Publication types
MeSH terms
Grants and funding
LinkOut - more resources
Full Text Sources
Other Literature Sources
