. 2012 Aug 7;22(15):1397-402.
doi: 10.1016/j.cub.2012.05.032. Epub 2012 Jul 5.

Ultraviolet light provides a major input to non-image-forming light detection in mice

Affiliations

Ultraviolet light provides a major input to non-image-forming light detection in mice

Floor van Oosterhout et al. Curr Biol. .

Abstract

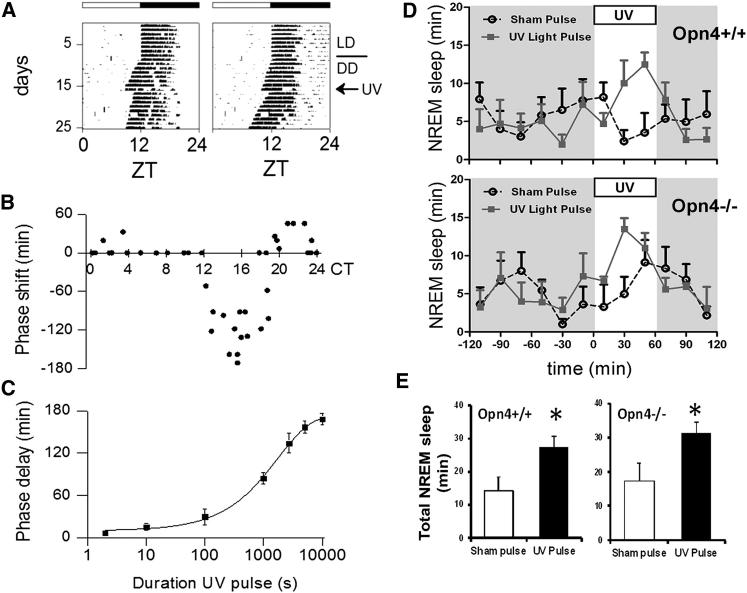
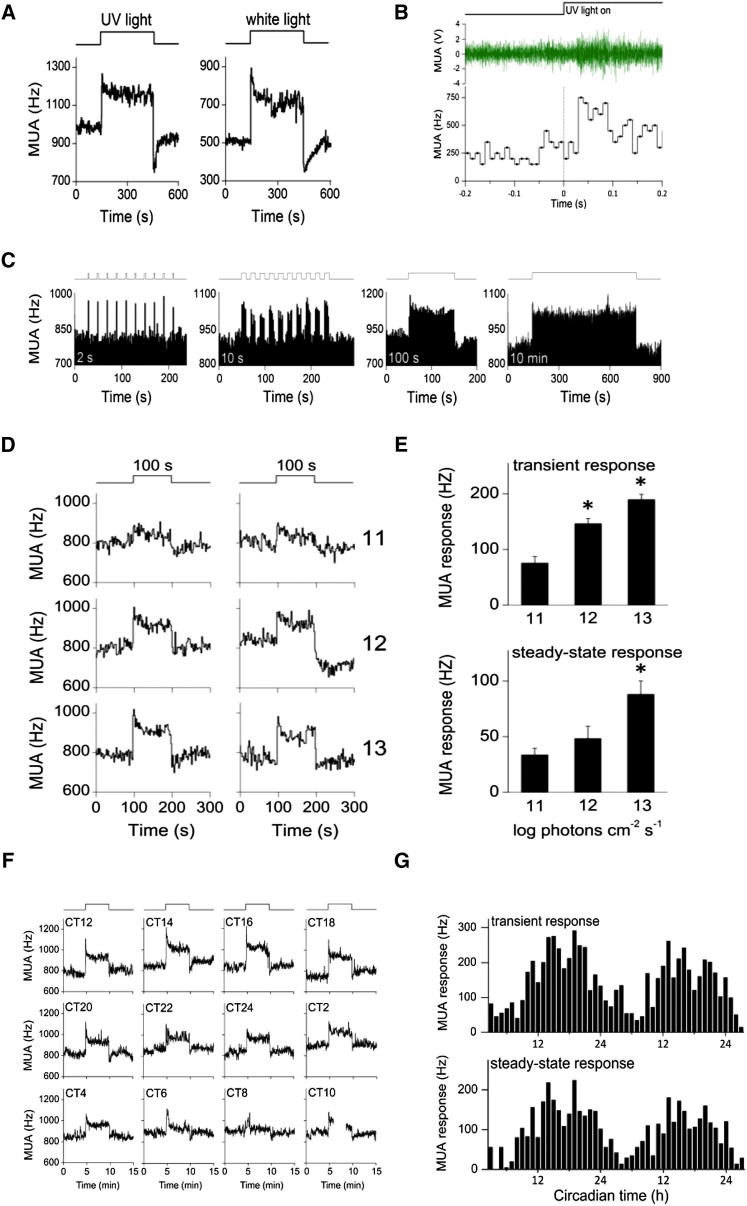
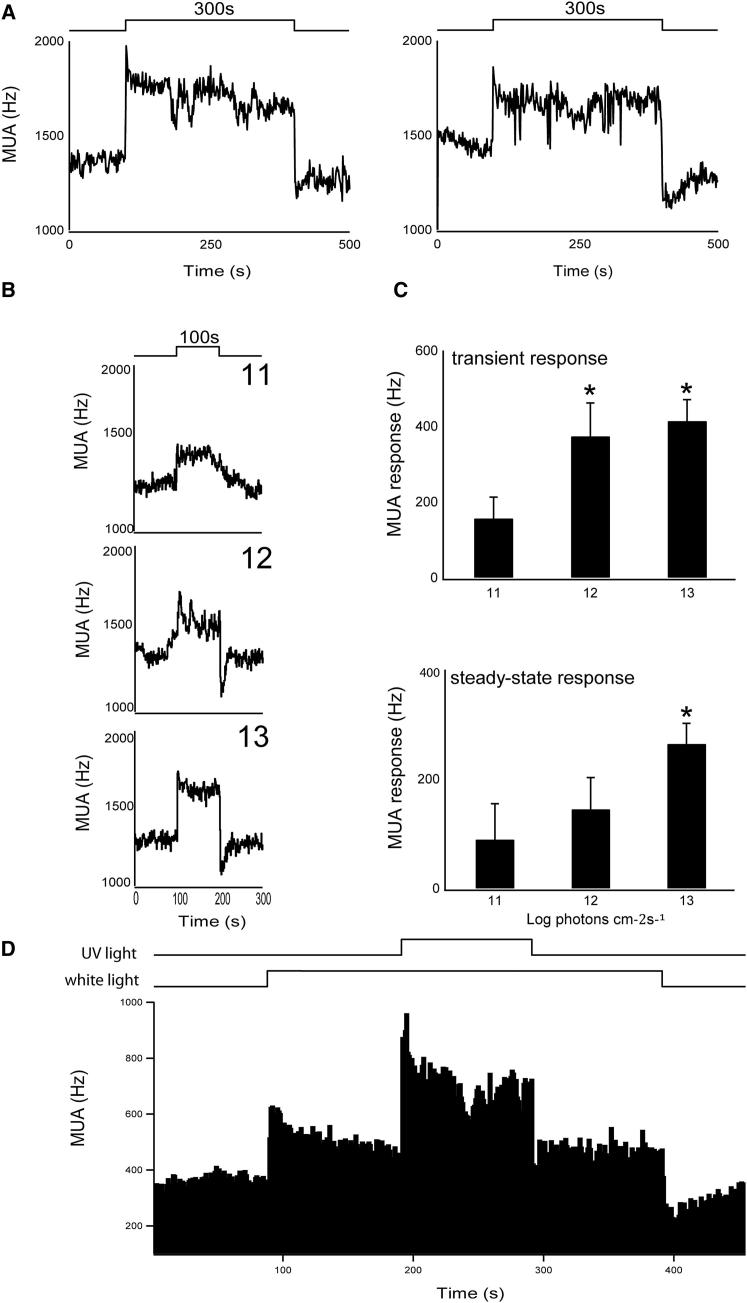
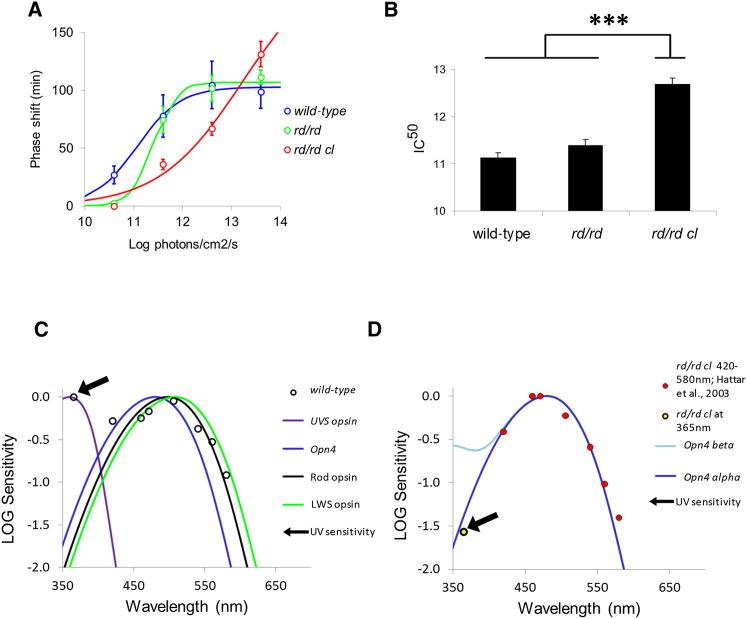
The change in irradiance at dawn and dusk provides the primary cue for the entrainment of the mammalian circadian pacemaker. Irradiance detection has been ascribed largely to melanopsin-based phototransduction [1-5]. Here we examine the role of ultraviolet-sensitive (UVS) cones in the modulation of circadian behavior, sleep, and suprachiasmatic nucleus (SCN) electrical activity. UV light exposure leads to phase-shifting responses comparable to those of white light. Moreover, UV light exposure induces sleep in wild-type and melanopsin-deficient (Opn4(-/-)) mice with equal efficacy. Electrical recordings from the SCN of wild-type mice show that UV light elicits irradiance-dependent sustained responses that are similar to those induced by white light, with characteristic fast transient components occurring at the light transitions. These responses are retained in Opn4(-/-) mice and preserved under saturating photopic conditions. The sensitivity of phase-shifting responses to UV light is unaffected by the loss of rods but is severely attenuated by the additional loss of cones. Our data show that UVS cones play an important role in circadian and sleep regulation in mice.


Figures

Figure 1
Figure 1
Behavioral and NREM Sleep Responses to UV Light (A) Representative actograms showing the phase-shifting response of wheel running activity to UV light in C57BL/6 mice. UV light pulses were applied on the seventh day in continuous darkness (DD) (CT15). (B) Phase response curve (PRC) of wheel running activity to UV light pulses (365 nm, 12.9 log quanta/cm2/s, 45 min exposure). Phase-shift magnitude and direction are plotted as a function of the circadian time. (C) Duration effects of phase shifts in response to UV light exposure at CT16 (365 nm, 12.9 log quanta/cm2/s). Phase shifts are duration dependent, increasing in magnitude with longer light exposure as has been previously shown for white light. Data points indicate mean ± SEM. (D) Time course of nonrapid eye movement (NREM) sleep following UV light exposure, showing mean responses ± SEM in Opn4+/+ and Opn4−/− mice (n = 5). (E) Histograms summarizing changes in NREM sleep ± SEM in response to UV light exposure. UV light administered at zeitgeber time 16–17 resulted in a significant increase in NREM sleep in Opn4+/+ and Opn4−/− mice. p < 0.05. See also Figure S1.
Figure 2
Figure 2
SCN Electrical Activity Responses to UV Light in Freely Moving Mice (A) Representative suprachiasmatic nucleus (SCN) multiunit activity (MUA) responses to a 5 min UV light or white light pulse. Bin size = 2 s. (B) Response latency to UV light. Time of lights-on is indicated by the step diagram. Green line shows a representative trace of multiunit activity in the SCN, with spike frequency above threshold shown below (bin size = 0.01 s). Vertical line indicates the time of UV onset (t = 0). SCN firing rate is increased in response to UV light, with a latency of 0.04 s. (C) MUA responses to UV light pulses of different durations, applied between CT14 and CT16. From left to right: 2 s lights-on, 18 s lights-off (10×); 10 s lights-on, 10 s lights-off (10×); 100 s lights-on; 10 min lights-on. Stimulus presentation is indicated by the step diagram above each plot. (D) Representative traces of SCN electrical activity to 100 s UV light pulses of different irradiances. Two examples are shown for each irradiance level. Log quanta/cm2/s is indicated on the right. (E) Summary of mean MUA response magnitudes ± SEM as a function of UV irradiance (11, 12, and 13 log quanta/cm2/s; n = 8, n = 8, and n = 7, respectively). Upper graph shows the transient response and the lower graph shows the steady-state level for the three irradiance levels. (F) Examples of SCN responses to 5 min UV light pulses at different times of the circadian cycle. (G) Offline analysis shows a clear circadian rhythm in transient “on-response” magnitude (upper graph) and in steady-state response magnitude (lower graph). The transient and steady-state responses were plotted versus circadian time over 48 hr. p < 0.05. See also Figure S2.
Figure 3
Figure 3
Responses to UV Light in the Absence of Melanopsin and under Photopic Light Conditions (A) Two representative traces of SCN MUA in response to 5 min UV light exposure in Opn4−/− mice. MUA responses to UV light typically show a fast transient increase in spike frequency to lights-on, a sustained response during light exposure, and a fast transient decrease at lights-off. (B) Representative electrical responses to 100 s UV light exposure at three different irradiances. (C) Histograms showing mean MUA responses ± SEM as a function of UV irradiance (11, 12, and 13 log quanta/cm2/s; n = 4–7 per irradiance). Upper graph shows changes in the transient response and the lower graph shows changes in the steady-state response as a function of irradiance. (D) Representative SCN neuronal response to UV light under saturating white light in a wild-type mouse. An excitatory response of the SCN electrical discharge rate was induced by exposure to saturating white light. After 100 s, a 100 s UV light pulse was applied, which evoked a significant increment of 146% in the sustained SCN firing rate compared to saturating white light (n = 3). The light protocol is indicated by the bars above the graph. p < 0.05. See also Figure S3.
Figure 4
Figure 4
Phase-Shifting Responses to UV Light Are Cone Dependent (A) Irradiance response curves (IRCs) for phase-shifting responses ± SEM of wild-type C3H, rd/rd, and rd/rd cl mice to UV light (15 min pulse at CT16, 365 nm UV LEDs). (B) Sensitivity to UV light was assessed by IRC IC50. Mice lacking rods and retaining a reduced population of cones (rd/rd) show no reduction in UV sensitivity compared to wild-type controls. By contrast, mice lacking all rods and all cones (rd/rd cl) show a significant attenuation of UV sensitivity, with an IC50 1.57 log units higher than controls (p = 1.80 × 10−5). Data points indicate mean ± SEM. (C) Action spectrum for circadian phase shifting in wild-type mice. Full irradiance response curves were constructed for eight monochromatic wavelengths (365, 420, 460, 471, 506, 540, 560, and 580 nm; see Figure S4A). Action spectrum data are plotted against the known photopigments of the mouse retina (UVS cone λmax = 360 nm, Opn4 λmax = 480, rod λmax = 498 nm, LWS cone λmax = 508 nm). (D) Action spectrum for circadian phase shifting in rd/rd cl mice. The irradiance response curve from Figure 4A was used to determine the sensitivity at 365 nm. For comparison, we have used our previously published data for 420, 460, 471, 506, 540, 560, and 580 nm [35]. Action spectrum data are plotted against the known absorption spectrum for the Opn4 photopigment (λmax = 480), the only known photopigment remaining in the rd/rd cl retina. The full absorbance spectrum of any opsin/vitamin A visual pigment consists of an alpha band in the visual range (e.g., the alpha band λmax for melanopsin is at 480 nm) and a smaller-amplitude and significantly shorter wavelength absorbance beta band (e.g., the beta band λmax for melanopsin is at 345 nm). Normally only the alpha band is shown. Both the alpha and beta bands are shown in (D). Absorption by the beta band has been proposed as one mechanism whereby a photopigment with an alpha band in the visual range might still show relatively high sensitivity to UV light [36]. However, the strong match between the alpha band absorbance for melanopsin and UV sensitivity shown in (D) provides no evidence for beta band involvement.

References

    1. Berson D.M., Dunn F.A., Takao M. Phototransduction by retinal ganglion cells that set the circadian clock. Science. 2002;295:1070–1073. - PubMed
    1. Brown T.M., Wynne J., Piggins H.D., Lucas R.J. Multiple hypothalamic cell populations encoding distinct visual information. J. Physiol. 2011;589:1173–1194. - PMC - PubMed
    1. Drouyer E., Rieux C., Hut R.A., Cooper H.M. Responses of suprachiasmatic nucleus neurons to light and dark adaptation: relative contributions of melanopsin and rod-cone inputs. J. Neurosci. 2007;27:9623–9631. - PMC - PubMed
    1. Gooley J.J., Rajaratnam S.M., Brainard G.C., Kronauer R.E., Czeisler C.A., Lockley S.W. Spectral responses of the human circadian system depend on the irradiance and duration of exposure to light. Sci. Transl. Med. 2010;2:31ra33. - PMC - PubMed
    1. Mure L.S., Rieux C., Hattar S., Cooper H.M. Melanopsin-dependent nonvisual responses: evidence for photopigment bistability in vivo. J. Biol. Rhythms. 2007;22:411–424. - PMC - PubMed

Publication types