. 2012 Aug 10;47(3):457-68.
doi: 10.1016/j.molcel.2012.05.046. Epub 2012 Jul 5.

Snail regulates MyoD binding-site occupancy to direct enhancer switching and differentiation-specific transcription in myogenesis

Affiliations

Snail regulates MyoD binding-site occupancy to direct enhancer switching and differentiation-specific transcription in myogenesis

Vahab D Soleimani et al. Mol Cell. .

Abstract

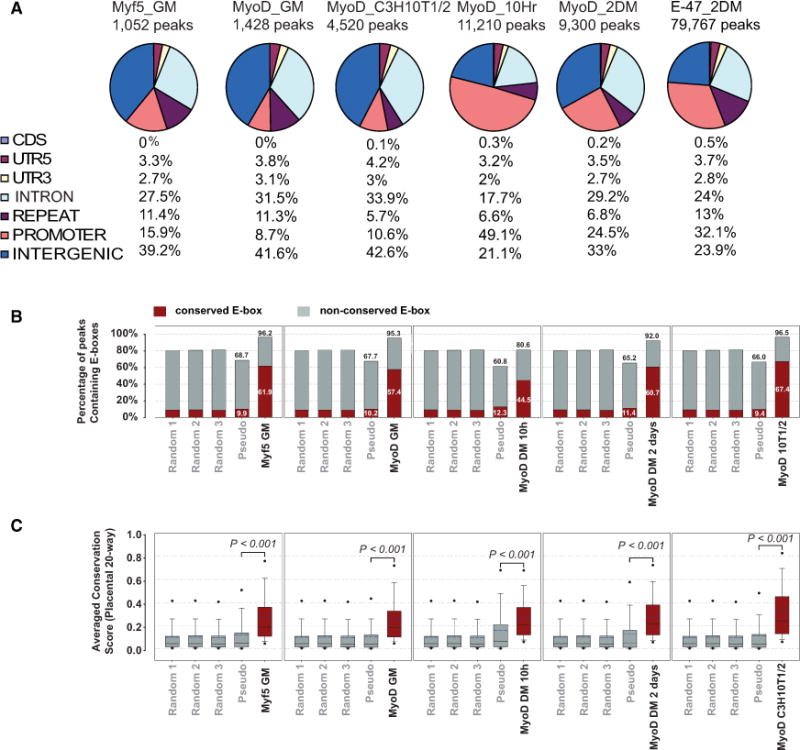
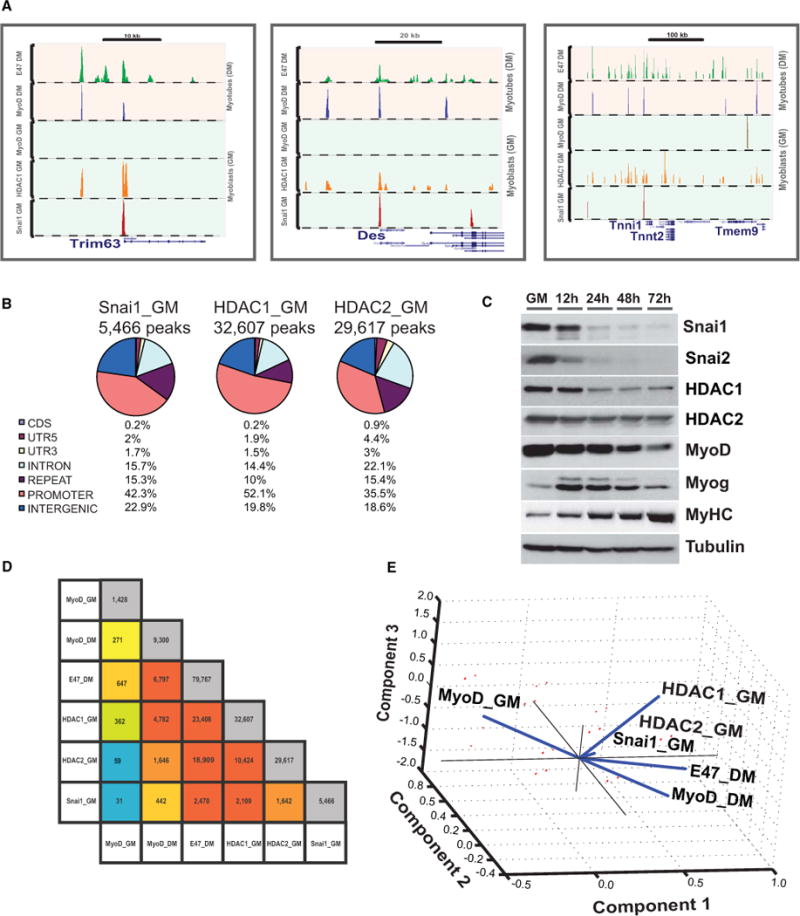
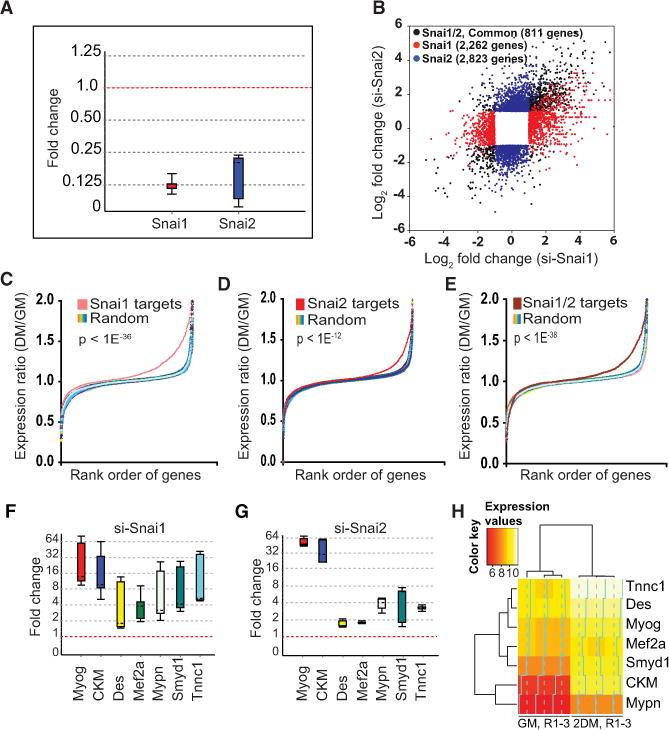
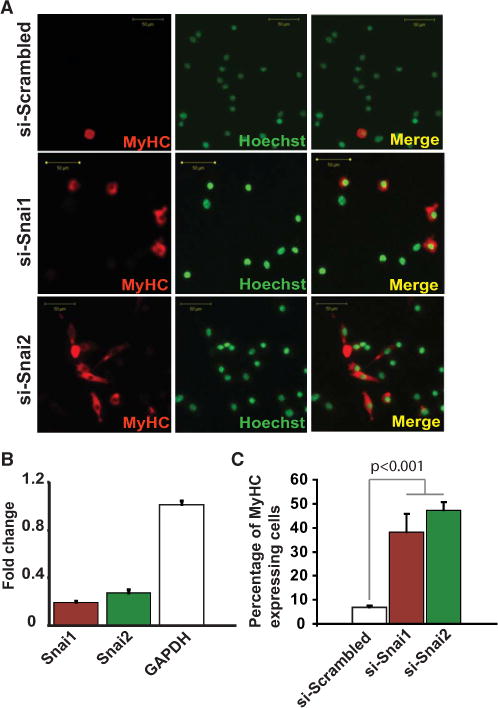
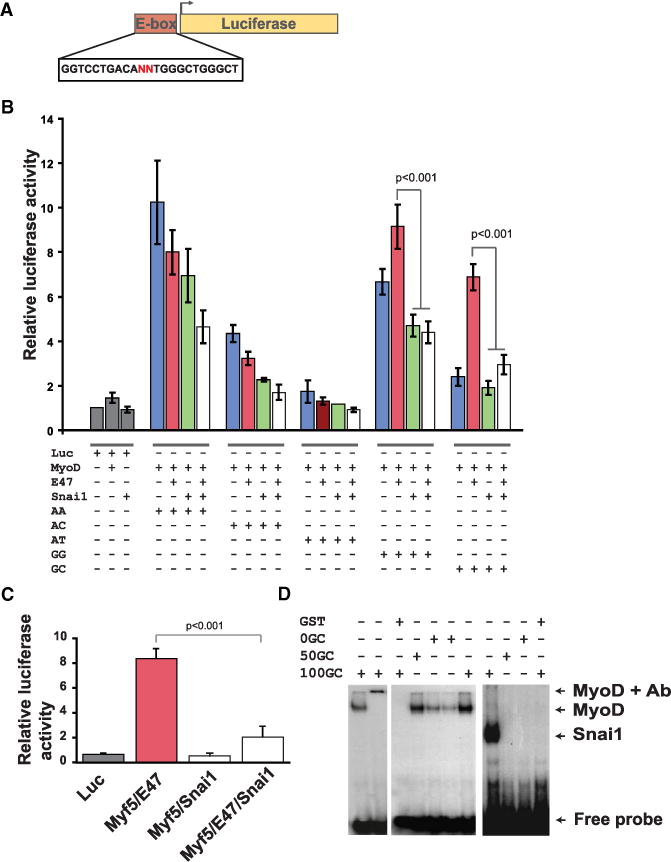
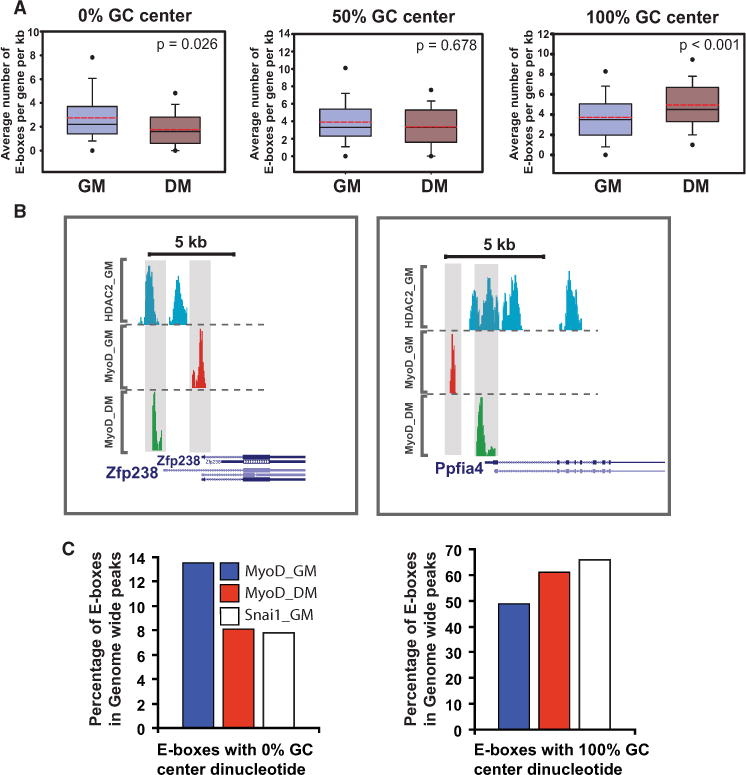
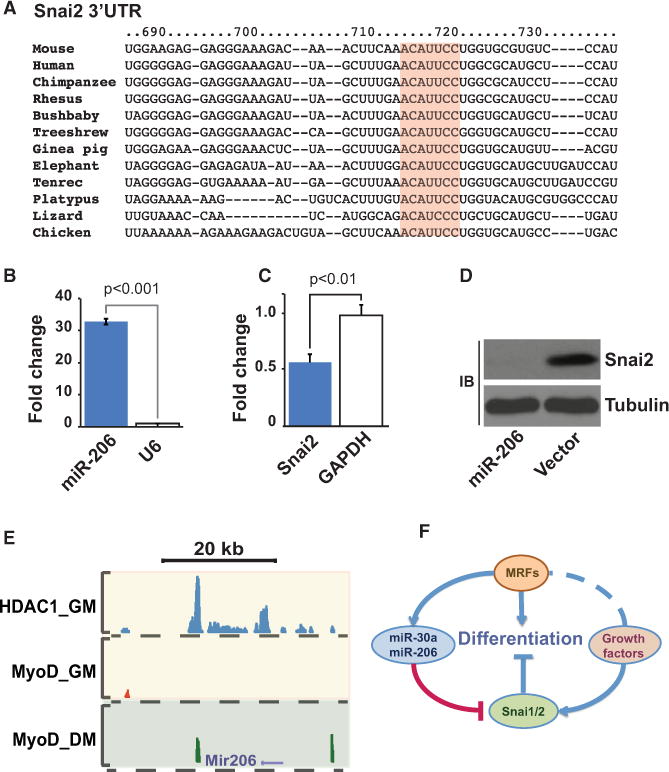
In skeletal myogenesis, the transcription factor MyoD activates distinct transcriptional programs in progenitors compared to terminally differentiated cells. Using ChIP-Seq and gene expression analyses, we show that in primary myoblasts, Snail-HDAC1/2 repressive complex binds and excludes MyoD from its targets. Notably, Snail binds E box motifs that are G/C rich in their central dinucleotides, and such sites are almost exclusively associated with genes expressed during differentiation. By contrast, Snail does not bind the A/T-rich E boxes associated with MyoD targets in myoblasts. Thus, Snai1-HDAC1/2 prevent MyoD occupancy on differentiation-specific regulatory elements, and the change from Snail to MyoD binding often results in enhancer switching during differentiation. Furthermore, we show that a regulatory network involving myogenic regulatory factors (MRFs), Snai1/2, miR-30a, and miR-206 acts as a molecular switch that controls entry into myogenic differentiation. Together, these results reveal a regulatory paradigm that directs distinct gene expression programs in progenitors versus terminally differentiated cells.


Figures

Figure 1
Figure 1. MyoD and Myf5 Binding Sites Are Highly Conserved
(A) Distribution of MyoD, Myf5, and E47 binding sites throughout muscle cell development. Numbers (percentages) indicate the distribution of various genomic features. GM, myoblasts in growth medium (proliferating myoblasts); DM, myotubes in differentiation medium. (B) Comparison of conservation scores of E boxes in MyoD and Myf5 ChTAP-Seq peaks with those of pseudopeaks (control) and random genomic blocks (see the Supplemental Experimental Procedures). Red and gray indicate conserved and unconserved E boxes, respectively. (C) Average conservation scores of MyoD and Myf5 ChTAP-Seq peaks. Scores are based on placental 20-way phastcon conservation scores. Black dots represent the fifth and the ninety-fifth percentiles. Bars represent the tenth and the ninetieth percentiles. In-box dashed lines represent means, and solid lines represent median values. See also Table S1, Table S3, Table S4, Table S5, Table S7, and Figure S1.
Figure 2
Figure 2. Dynamic Switch of Snai1/HDACs and MyoD/E47 during Differentiation
(A) Switch from repressive (Snai1/HDAC1) to activating (MyoD/E47) on a representative set of genes during myogenic differentiation. (B) Genome-wide distribution of Snai1, HDAC1, and HDAC2 binding sites in growing primary skeletal myoblasts. Numbers (percentages) indicate the distribution of peaks within various genomic features. (C) Western blots analysis of differentiation time course of myoblasts (GM) to myotubes (72 hr) in differentiation media. Snai1, Snai2, and MyoD have overlapping expression in myoblasts but not in myotubes. (D) Pairwise overlaps of binding sites of MyoD, E47, Snai1, HDAC1, and HDAC2. Diagonal shows the total number of binding sites per factor. Color represents the extent of overlap from blue to red, lowest to the highest. (E) PCA used to visualize the overall relationship among six ChIP-Seq data sets. PCA was performed using an input binary matrix of 1 and 0 s for presence and absence of a peak on a given genomic site, respectively. See also Table S2, Table S6, and Figure S2 and Figure S3.
Figure 3
Figure 3. Snai1 and Snai2 Repress Differentiation Genes
(A) Transient in vivo depletion of Snai1 and Snai2 in growing primary skeletal myoblasts by siRNA. Whisker box plots were generated using REST 2009 Qiagen software (Pfaffl et al., 2002) to assess the relative abundance of transcript level using gene-specific primers (Supplemental Experimental Procedures). The box represents 50% of all observations, dashed line inside the box represents median. Top and bottom whiskers represent upper and lower twenty-fifth percentiles, respectively. GAPDH (housekeeping gene) was used as reference for normalization. (B) Scatterplot of significantly regulated genes in si-Snai1- and si-Snai2-treated myoblasts. RNA-seq analysis was performed on purified mRNA. Black circles represent significantly regulated (fold change >2, p value <10−5) genes common between si-Snai1- and si-Snai2-treated myoblasts, red circles represent genes that are significantly up- or downregulated in si-Snai1, and blue circles represent genes that are significantly up- or downregulated in si-Snai2-treated myoblasts. An si-Scrambled siRNA was used as a control. (C) Genes that are repressed by Snai1 are upregulated during differentiation. Gene expression profile of Snai1 targets (red) versus an equal number of randomly selected set of genes (rainbow) taken from microarray analysis of wild-type myoblasts and myotubes shows that genes that are repressed by Snai1 are primarily upregulated during differentiation. The ratio of myotubes to myoblasts (DM/GM) is log2 ratio of normalized expression between myotubes, 2 days in DM, divided by their corresponding expression values in myoblasts. Controls (rainbow) represent ten randomly selected sets of probes after randomizing the order of probes on Affymetrix chip. p values are based on the Kolmogorov-Smirnov probability distribution. (D and E) Similar analysis as in (C) for Snai2 and Snai1/2 targets, respectively, showing that genes repressed by Snai2 are primarily those that are upregulated during differentiation. (F) Real-time RT-qPCR validation of a subset of Snai1 targets showing upregulation of these genes in si-Snai1-treated myoblasts relative to si-Scrambled treated control myoblasts, as described in (A). Also, see the Supplemental Experimental Procedures for primer sequences. (G) Real-time RT-qPCR validation of a subset of Snai2 target genes using gene-specific primers as described in (F). (H) A heat map based on the hierarchical clustering showing the expression pattern of genes from (F) and (G) during muscle cell differentiation program. Input expression data are from microarray analysis.
Figure 4
Figure 4. Snai1 and Snai2 Inhibit Myogenic Differentiation
(A) Immunostaining of in vitro cultures of primary skeletal myoblasts treated with si-Snai1, si-Snai2, or si-Scrambled (control). Depletion of Snai1 or Snai2 results in precocious differentiation of myoblasts under growth conditions as shown by a significant increase in the number of myosin heavy-chain (MyHC)-expressing cells (red) in the si-Snai1- or si-Snai2-treated myoblasts compared to the control. Nuclei were counterstained with Hoechst (green). (B) Real-time RT-PCR with gene-specific primers showing the extent of knockdown of Snai1 and Snai2 compared to si-Scrambled (control). (C) Quantification of MyHC expressing myoblasts from (A) compared to the baseline spontaneous differentiation of a control from (A). Error bars represent standard deviation (n = 3). See also Figure S4.
Figure 5
Figure 5. Snai1 Competes with MyoD on G/C-Rich E Boxes
(A) A multimerized (3×) oligonucleotide containing canonical E box (CANNTG) was subcloned into pGL4.23 luciferase construct. (B) Relative luciferase activity showing the outcome of competition between MyoD versus Snai1 and MyoD/E47 versus Snai1 on a set of E boxes ranging from 0% to 100% GC content in their center, variable dinucleotides in Cos7 cells. Transfections were done using polyethylenimine (PEI) with 1:1 molar ratio of plasmids in competition assays. Error bars represent standard deviation (n = 9). (C) Snai1 competes against Myf5 on CAGGTG E box similar to in (B). (D) EMSA of MyoD and Snai1 on E boxes with various GC content in their center dinucleotides. GST-tagged MyoD and Snai1 were expressed in E. coli, and proteins were purified using GST-tagged protein purification system.
Figure 6
Figure 6. Enhancer Switching on Differentiation-Induced Genes
(A) Distribution of E box classes with various GC content in their center dinucleotides associated with MyoD peaks in growth and differentiation for MyoD targets genes that are upregulated during myogenic differentiation for all MyoD peaks within ±10 kb of the TSS. y axis shows the average number of E boxes per peaks per gene, normalized per kilobase. In-box dashed red line indicates mean, solid line (black) indicates median. Lower and upper solid circles indicate the fifth and ninety-fifth percentiles, respectively. p values are calculated based on the Wilcoxon signed rank test. (B) Binding pattern of MyoD on two representative genes from (A). (C) Genome-wide distribution pattern of E boxes (0%, 50%, and 100% GC content in their center dinucleotides) among MyoD GM, MyoD 2DM, and Snai1 GM ChIP-Seq data sets.
Figure 7
Figure 7. A Regulatory Network Controls Entry into Myogenic Differentiation
(A) Snai2 is a target of miR-206. The 3UTR of Snai2 contains miR-206 binding sequence. The seed sequence (highlighted) is highly conserved among vertebrates. (B) Ectopic overexpression of miR-206 in primary myoblasts. (C) Transient transfection of primary myoblasts with miR-206 plasmid results in significant reduction in Snai2 transcript. (D) Transient transfection of Cos7 cells with miR-206 expression plasmid results in near-complete elimination of Snai2 protein. The high efficiency of miR-206-mediated removal of Snai2 in Cos7 cells is due to high transfection efficiency of the latter cell line compared to primary myoblasts. (E) MyoD binds to Mir206 promoter during differentiation. In growing myoblasts, the promoter of Mir206 is occupied with HDAC1. (F) A regulatory loop controls entry into myogenic differentiation. At the onset of differentiation, MRFs target miR-30a and miR-206, which in turn remove Snai1 and Snai2 transcripts, respectively. Incremental removal of Snai1/2 weakens Snai1/2-HDAC1/2 complex and tilts the balance toward MyoD/E-protein activating complex, allowing progression of differentiation. See also Figure S5.

References

    1. Asakura A, Seale P, Girgis-Gabardo A, Rudnicki MA. Myogenic specification of side population cells in skeletal muscle. J Cell Biol. 2002;159:123–134. - PMC - PubMed
    1. Barndt R, Dai MF, Zhuang Y. A novel role for HEB downstream or parallel to the pre-TCR signaling pathway during alpha beta thymopoiesis. J Immunol. 1999;163:3331–3343. - PubMed
    1. Bentzinger CF, Wang YX, Rudnicki MA. Building muscle: molecular regulation of myogenesis. Cold Spring Harb. Perspect Biol. 2012;4 http://dx.doi.org/10.1101/cshperspect.a008342. - DOI - PMC - PubMed
    1. Bergstrom DA, Penn BH, Strand A, Perry RL, Rudnicki MA, Tapscott SJ. Promoter-specific regulation of MyoD binding and signal transduction cooperate to pattern gene expression. Mol Cell. 2002;9:587–600. - PubMed
    1. Berkes CA, Tapscott SJ. MyoD and the transcriptional control of myogenesis. Semin Cell Dev Biol. 2005;16:585–595. - PubMed

Publication types

MeSH terms

Substances

Associated data