Review
. 2012 Nov;31(6):661-87.
doi: 10.1016/j.preteyeres.2012.06.003. Epub 2012 Jul 5.

Cell replacement and visual restoration by retinal sheet transplants

Affiliations
Review

Cell replacement and visual restoration by retinal sheet transplants

Magdalene J Seiler et al. Prog Retin Eye Res. 2012 Nov.

Abstract

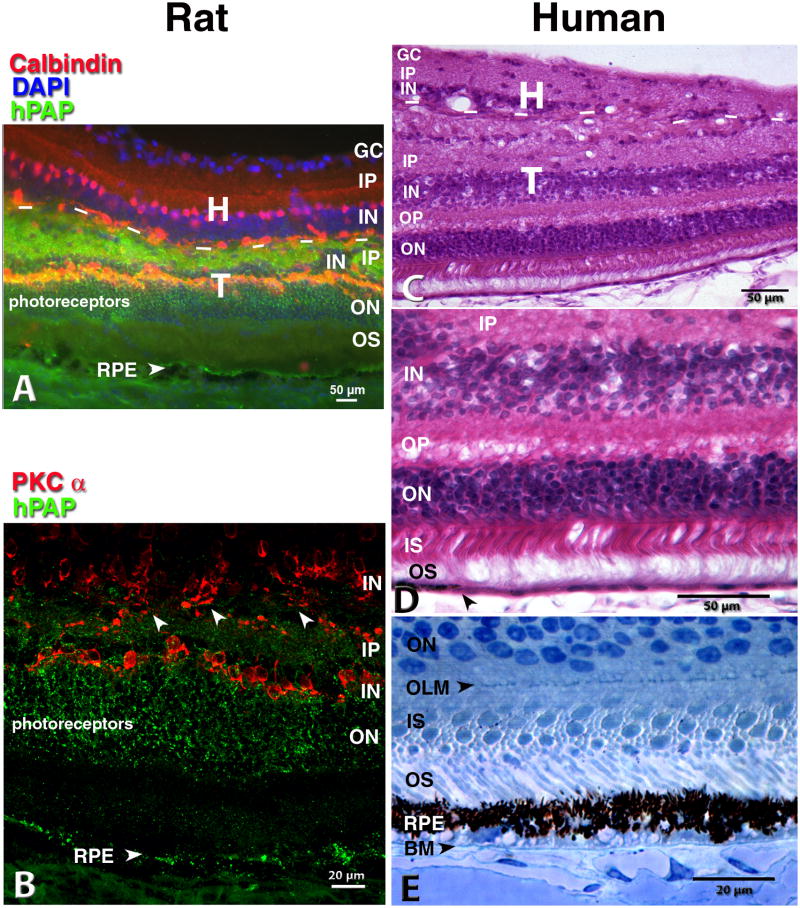
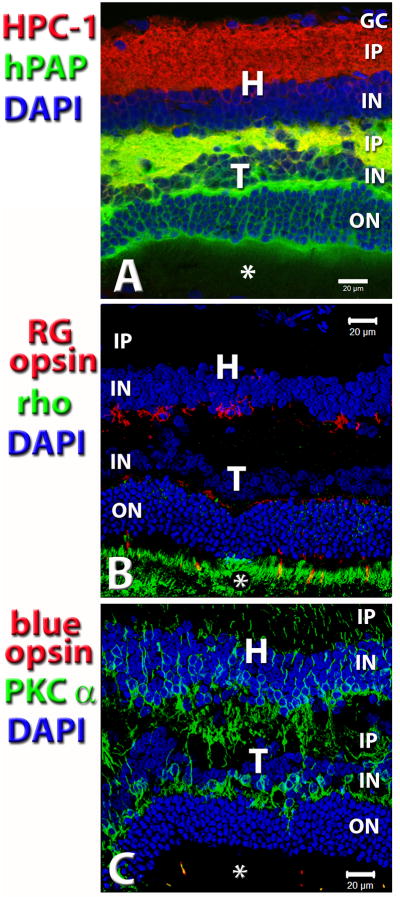
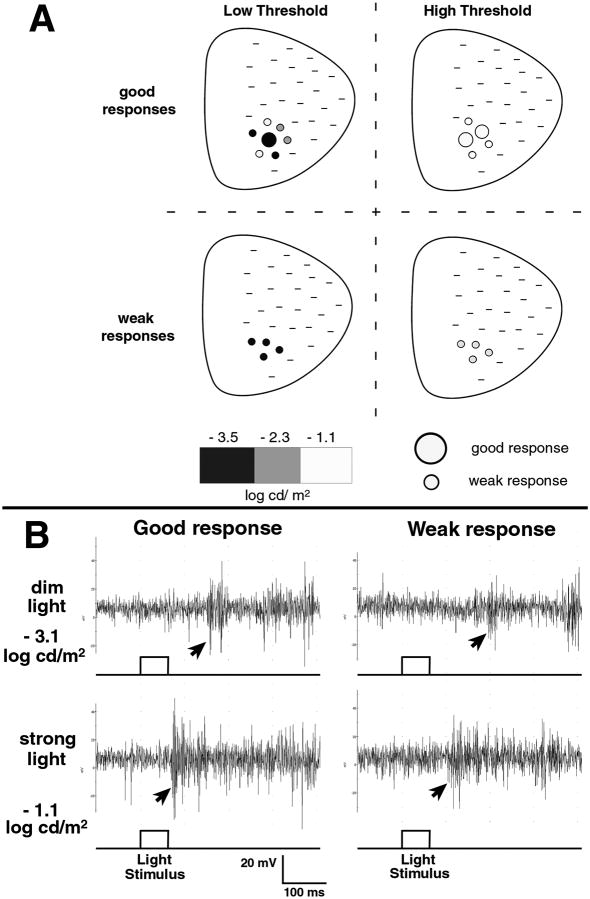
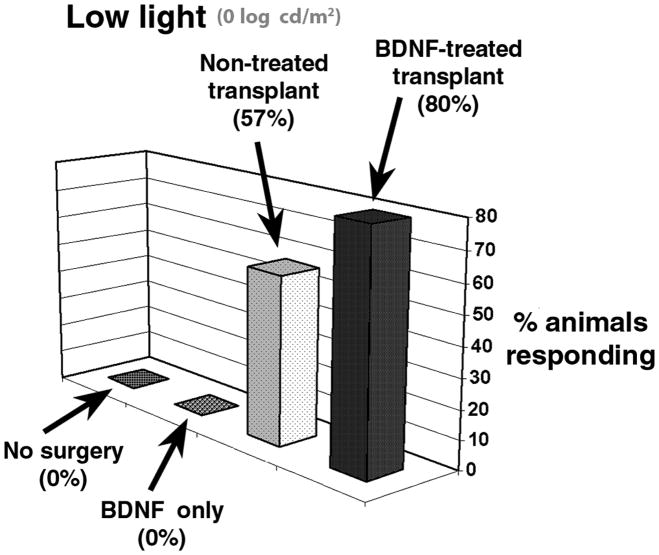
Retinal diseases such as age-related macular degeneration (ARMD) and retinitis pigmentosa (RP) affect millions of people. Replacing lost cells with new cells that connect with the still functional part of the host retina might repair a degenerating retina and restore eyesight to an unknown extent. A unique model, subretinal transplantation of freshly dissected sheets of fetal-derived retinal progenitor cells, combined with its retinal pigment epithelium (RPE), has demonstrated successful results in both animals and humans. Most other approaches are restricted to rescue endogenous retinal cells of the recipient in earlier disease stages by a 'nursing' role of the implanted cells and are not aimed at neural retinal cell replacement. Sheet transplants restore lost visual responses in several retinal degeneration models in the superior colliculus (SC) corresponding to the location of the transplant in the retina. They do not simply preserve visual performance - they increase visual responsiveness to light. Restoration of visual responses in the SC can be directly traced to neural cells in the transplant, demonstrating that synaptic connections between transplant and host contribute to the visual improvement. Transplant processes invade the inner plexiform layer of the host retina and form synapses with presumable host cells. In a Phase II trial of RP and ARMD patients, transplants of retina together with its RPE improved visual acuity. In summary, retinal progenitor sheet transplantation provides an excellent model to answer questions about how to repair and restore function of a degenerating retina. Supply of fetal donor tissue will always be limited but the model can set a standard and provide an informative base for optimal cell replacement therapies such as embryonic stem cell (ESC)-derived therapy.


Figures

Figure 1
Figure 1. Rat and human retina, transplanted together with its RPE to the subretinal space
From a sheet of neuroblastic cells, the transplant develops most retinal layers and cell types together with a monolayer of RPE seemingly in interaction with host choroid. A) B) Rat transplant to RCS rat 5.6 mo. after surgery; C) D) E) human transplant to nude rat 11.7 mo. after surgery. (A) Double staining: Green hPAP label of all donor cells' cytoplasm, including processes, in combination with Calbindin (red) that labels horizontal and some amacrine cells. Nuclei are stained with DAPI (blue). Dashed lines: approximate border between transplant and host. Orange band of transplant horizontal cells double-stained for hPAP and Calbindin. The host horizontal cells border the transplant-host interface. The choroid shows some unspecific green autofluorescence which can be clearly distinguished from specific staining in the confocal microscope (B). (B) Single confocal scan of adjacent section: donor hPAP (green) and rod bipolar cells (PKC alpha, red). Arrow heads indicate areas with potentially crossing processes. Note the hPAP label of the co-transplanted RPE cells in A) and B). (C, D,E) Human transplant to normal albino athymic nude rats. C),D), Donor 12 weeks post-conception, 11.7 months after surgery, H-E staining. The transplant has developed all retinal layers with the exception of ganglion cells. (D) Enlargement of C). Arrow head in D) indicates transition from pigmented to non-pigmented RPE. (E) Toluidine blue-stained 1 μm semithin section. Human donor 14 weeks post-conception, 8.9 months post-surgery. Inner segments of individual transplant cones and rods clearly outlined. Normal appearing donor RPE with apical melanosomes adjacent to transplant photoreceptor outer segments. Close to the human Bruch's membrane, many rat host choroidal blood vessels can be seen. No trace of host albino rat RPE. Image in A) taken with standard Nikon FXA fluorescence microscope and deconvoluted (Autoquant, Autodeblur software 9.2 and 9.3). Scale bars: 50 μm (A,C,D), 20 μm (B,E). (A) Reprinted with permission from Seiler et al., 2008: Transplants of retinal layers– a hope to preserve and restore vision? Optonics and Photonics News, 19(4): 37-42. Copyright The Optical Society.
Figure 2
Figure 2. Analysis of marker expression and integration between transplant and host – indirect evidence that transplant is responsible for restoration of visual function
Laminated transplant in S334ter-3 rat with responses in the superior colliculus (SC). Confocal projection stacks, stained for antibodies listed on the left side. Nuclei are stained with DAPI (blue). Photoreceptor outer segments are indicated by asterisks. Retinal transplant, age 8.5 mo., 7.4 mo. post surgery. This rat had very good visual sensitivity; the threshold was at −2.2 log cd/m2. (A) Donor cell label hPAP (green) in combination with anti-Syntaxin-1 (HPC-1; red). HPC-1 stains synaptic layers and, more faintly, the cytoplasm of amacrine cells in the inner nuclear layers. (B) red-green (RG) opsin (red) in combination with rhodopsin (green). Strong staining of transplant outer segments for rhodopsin. Note that there is no rhodopsin staining in the host retina. There are scattered cell bodies with processes of residual RG opsin immunoreactive host cones (red) at the transplant-host interface. Cone outer segments can only be seen in the transplant. Consequently, only transplant photoreceptors can send strong signals to the brain. Cone opsin also stains cone terminals in the outer plexiform layer of the transplant. (C) Double label of PKC alpha (green) which stains rod bipolar cells and blue opsin (red) that stains blue-sensitive cones. PKC staining of bipolar cells is stronger in the transplant than in the host retina. Note the good integration. Outer segments of blue cones (two samples) can only be seen in the transplant. Scale bars: 20 μm. - Reprinted with permission from Yang et al., 2010: Trophic Factors GDNF and BDNF Improve Function of Retinal Sheet Transplants. Exp Eye Res 91: 727-738 (part of Figure 7). Copyright Elsevier.
Figure 3
Figure 3. Brain recording after light stimulus to the eye showing the light sensitivity of transplants – electrophysiology in the superior colliculus (SC)
(A) Response characteristics in the SC from transplanted retinal-degenerate S334ter-3 rats using a 60 ms light stimulus (schematic diagram). Modified recording setup for obtaining rod-specific responses (Thomas et al., 2005). Response thresholds were determined by testing at different light intensities (−3.5 to −1 log cd/m2), indicated by black, gray, and white, from an area of the SC corresponding to the transplant location in the eye. Lower thresholds indicate higher light sensitivity and more rod involvement in the response. Examples of 4 different response types are presented. (B) Recordings from 2 different transplanted rats (left and right column) at two different light intensities (−3.1 and −1.1 log cd/m2) to a 60 ms light stimulus. The onset of the visual response is indicated by arrows. ‘Good-response’ recordings are characterized by robust spike activity in response to increase in stimulus strength, whereas such an increase in spike activity is less apparent for ‘weak responses’. Such responses cannot be found in sham surgery controls at these light intensities. Good responses in dim light indicate restoration of light sensitivity to a higher level than before transplantation. (A), (B) Reprinted with permission from Seiler et al., 2008. Retinal transplants restore visual responses - Transsynaptic tracing from visually responsive site in the superior colliculus (SC) labels transplant neurons. Eur J. Neurosci, 28:208-220. Copyright Elsevier.
Figure 4
Figure 4. BDNF pretreatment of donor tissue improves transplant function – while BDNF treatment alone has no long-term effect in this retinal degenerated model
S334ter line 3 rats received E19 retinal sheet transplants with or without BDNF microsphere coating in one eye at the age of P24-37. SC recordings to light were done ca. 60 days post-surgery, at the age of 11-14 weeks. Responses were only found in the transplanted groups. A higher percentage of rats with BDNF treated transplants than rats with non-treated transplants responded to low light (1 cd/m2). Rats that received only injection of BDNF microspheres without transplant had no responses. Reprinted with permission from Seiler et al., 2008: BDNF-Treated Retinal Progenitor Sheets Transplanted to Degenerate Rats - Improved Restoration of Visual Function. Exp Eye Res. 86(1): 92-104 (part of Figure 5). Copyright Elsevier.
Figure 5
Figure 5. Tracing from visually responsive site in brain (superior colliculus, SC) to transplant in the eye - – Indirect evidence of connectivity using pseudorabies virus (PRV)
After electrophysiological recording in the SC, the trans-synaptic tracer PRV was injected into the area that had visual responses. Rats were sacrificed 2 d after virus injection, and PRV was detected in the eye by immunohistochemistry. (A), (B) hPAP (donor cell label) (red) and PRV (green), with blue counterstain of nuclei (DAPI). White arrowheads indicate PRV-labeled transplant cells. The merged image is on top; the 2nd row shows PRV (green); the 3rd row shows hPAP (red). - There is more inner plexiform layer in the transplant in A) (stronger hPAP stain) whereas the transplant area in B) contains more nuclei (less hPAP stain since hPAP is not found in nuclei. (A) Rat age 17.7 weeks at the time of recording, visual threshold −2.9 log cd/m2: Labeled cells in transplant close to the host and in inner nuclear layer (IN). (B) Rat age 16.3 weeks, visual threshold −3.5 log cd/m2. Labeled cells in transplant IN and outer nuclear layer (ON). There is less hPAP stain in the transplant in B) because the transplant area contains more nuclei. Transplant ON close to host IN. Scale bars: 20 μm - Reprinted with permission from Seiler et al., 2008. Retinal transplants restore visual responses - Transsynaptic tracing from visually responsive site in the superior colliculus (SC) labels transplant neurons. Eur J. Neurosci, 28:208-220. Copyright Elsevier.
Figure 6
Figure 6. Interface transplant-host: cell and synaptic markers
The cytoplasm of all donor cells, including their processes, is labeled with hPAP (green) in their cytoplasm (not the nuclei). Note the green donor cell processes in the host inner plexiform layer (IP), indicating outgrowth of processes from the transplant. All images are oriented with the host ganglion cell layer (GC) up. White asterisks (*) indicate nuclei of remnant host cones (containing clumped chromatin). All images are three-dimensional renderings of confocal stacks (not maximum intensity projections). (A1 and A2) Combination of donor label hPAP (green) and synapsin 1 (red, marker for synaptic vesicles and synaptic terminals), and DAPI nuclear label (blue). (A1) Overview. Transplant processes extend past remnants of host cones to the outer plexiform layer of the host. The arrowhead points to a group of transplant processes in the host IP that is slightly visible at this magnification, but can be clearly seen in B1, B2 and in Figure 7. The white dashed box indicates enlargement of the transplant–host interface in A2. (A2) Plentiful areas with potential transplant–host synaptic interactions (transplant processes close to red-stained synaptic structures inside the host area; only 2 examples indicated by arrows. (B1), B2), and C) Unpublished pictures of the same transplant. (B1) Recoverin (red), a marker for photoreceptors and cone bipolar cells and their processes, in combination with hPAP (green). The transplant photoreceptor layer stains strongly for recoverin. There are less, smaller-appearing recoverin-immunoreactive cone bipolar cells in the transplant IN than in the host IN. (B2) Enlargement of transplant-host interface. (C) PSD95 (marker for postsynaptic densities, red) in combination with hPAP (green) at the transplant-host interface. Note transplant process on the right, closely adjacent to PSD95-immunoreactive structures, indicating synaptic connections. E19 retinal transplant (no BDNF-treatment), age 3.0 months, 2.1 months after surgery. Scale bars: 20 μm (A1, B1, B2, C), 10 μm (A2). (A1, A2) Reprinted with permission from Seiler et al. 2010: Visual restoration and transplant connectivity in degenerate rats implanted with retinal progenitor sheets. Eur J. Neurosci, 31(3):508-520. Copyright J. Wiley & Sons.
Figure 7
Figure 7. Transplant processes invading host retina (transplants with visual responses in SC)
The cytoplasm of all transplanted cells, including their processes, is labeled by immunohistochemistry for human placental alkaline phosphatase (hPAP). Arrows indicate a dense donor-derived fiber plexus close to the GCL and close to the INL of the host retina (not so clear in the thin section, B). The two pictures are interesting with their difference in thickness. (A) is a 80 μm thick vibratome section and (B) is a semithin 1-μm section. Both pictures show the distribution of the donor processes all over the host inner plexiform layer and close to the ganglion cells (see also Figure 6 B1 and B2). (A) In this thick section, a dark dense process layer is seen under the GC and another less dense layer towards the host inner nuclear layer. (A) BDNF-treated transplant, age 3.6 months, 2.4 months after surgery. (B) BDNF-treated transplant, age 6.9 months, 6 months after surgery. Scale bars: 50 μm (A), 20 μm (B).
Figure 8
Figure 8. Ultrastructural demonstration of synaptic connectivity. Direct evidence
Transplant processes and synapses in the inner plexiform layer of the host retina (images from 4 different rats). Immunohistochemistry for human placental alkaline phosphatase, recognizable as silver grains. The sections could not be counterstained therefore many apparent synapses were too diffuse to document clearly. Arrows indicate a presynaptic element of an apparent synapse between transplant and host cell. (A) Labeled ribbon synapse. A long synaptic ribbon is indicated by asterisks. Labeled processes are presynaptic in A, D and E, and postsynaptic in B, C and F. Scale bars: 0.2 μm. Reprinted with permission from Seiler et al. 2010: Visual restoration and transplant connectivity in degenerate rats implanted with retinal progenitor sheets. Eur J. Neurosci, 31(3):508-520. Copyright J. Wiley & Sons.
Figure 9
Figure 9. Visual Improvement in Retinitis Pigmentosa Patient as shown by SLO microperimetry
The transplant area is outlined by yellow dots. A),C) Seeing and non-seeing areas. Seeing areas: filled white squares, non-seeing areas: open white squares; fixation points: black crosses. B), D) Fixation. (A) At 9 months post surgery, fixation was not stable, and sometimes involved retina over the transplant area as well as retina adjacent to the transplant. (B) The patient fixated a large size horizontal black “E” outside of the area of the transplant, at the nasal edge of the transplant. Acuity is 20/270. (C) At 2 years 3 months post surgery, the fixation is now more concentrated, apparently inside the transplant at the nasal edge. (D) The patient has improved acuity of 20/84 and fixated a small horizontal black “E”, appears inside the nasal edge of the transplant. A) B) Modified and reprinted with permission from Figure 3 of Radtke et al. Arch Ophthalmol. 2004;122:1159-1165. Copyright American Medical Association.

Similar articles

Cited by

References

    1. Abe T, Tomita H, Kano T, Yoshida M, Ohashi T, Nakamura Y, Nishikawa S, Tamai M. Autologous iris pigment epithelial cell transplantation in monkey subretinal region. Curr Eye Res. 2000a;20:268–275. - PubMed
    1. Abe T, Yoshida M, Tomita H, Kano T, Sato M, Wada Y, Fuse N, Yamada T, Tamai M. Auto iris pigment epithelial cell transplantation in patients with age-related macular degeneration: short-term results. Tohoku J Exp Med. 2000b;191:7–20. - PubMed
    1. Abe T, Yoshida M, Yoshioka Y, Wakusawa R, Tokita-Ishikawa Y, Seto H, Tamai M, Nishida K. Iris pigment epithelial cell transplantation for degenerative retinal diseases. Prog Retin Eye Res. 2007;26:302–321. - PubMed
    1. Adolph AR, Zucker CL, Ehinger B, Bergstrom A. Function and structure in retinal transplants. J Neural Transplant Plast. 1994;5:147–161. - PMC - PubMed
    1. Aisenbrey S, Lafaut BA, Szurman P, Hilgers RD, Esser P, Walter P, Bartz-Schmidt KU, Thumann G. Iris pigment epithelial translocation in the treatment of exudative macular degeneration: a 3-year follow-up. Arch Ophthalmol. 2006;124:183–188. - PubMed

Publication types